Article Text

Abstract
Background It has been argued that as smoking prevalence declines in countries, the smokers that remain include higher proportions of those who are unwilling or unable to quit (a process known as ‘hardening’). Smokeless tobacco and e-cigarettes have been promoted as a strategy to deal with such smokers. If hardening is occurring, there would be a positive association between smoking prevalence and quitting, with less quitting at lower prevalence. There would also be a neutral or negative association between prevalence and the number of cigarettes smoked.
Methods We examined US state-level associations using the Tobacco Use Supplement (1992/1993–2010/2011) and Eurobarometer surveys for 31 European countries (2006–2009–2012) using regressions of quit attempts, quit ratios, and number of cigarettes smoked on smoking prevalence over time.
Results For each 1% drop in smoking prevalence, quit attempts increase by 0.55%±.07 (p<0.001) in the USA and remain stable in Europe (p=0.53), US quit ratios increase by 1.13%±0.06 (p<0.001), and consumption drops by 0.32 cig/day±0.02 (p<0.001) in the USA and 0.22 cig/day±0.05 (p<0.001) in Europe. These associations remain stable over time (p>0.24), with significantly lower consumption at any given prevalence level as time passed in the USA (−0.15 (cig/day)/year±0.06, p<0.05).
Conclusions Consistent with prior research using different data and methods, these population-level results reject the hypothesis of hardening as smoking prevalence drops, instead supporting softening of the smoking population as prevalence declines.
- Addiction
- Cessation
- Public policy
- Surveillance and monitoring
Statistics from Altmetric.com
Introduction
Smokeless tobacco and, more recently, e-cigarettes have been promoted as a harm reduction strategy for smokers who are unable or unwilling to quit1 ,2 ,3 ,4 on the assumption that as those who are able and willing to quit do so, a group of hardcore smokers will be left behind. The concept of harm reduction was first proposed by Russell5 ,6 when he suggested offering smokers a less harmful source of nicotine than combusted cigarettes. While there is no formal definition of hardening, it has been described as the smoking population becoming, on average, less willing to or less capable of quitting as smoking prevalence declines,7 ,8 ,9 so that hardcore smokers would increasingly comprise the remaining smoking population.9 ,10 We use the common definition of a hardcore smoker as a smoker who will not or cannot quit.7 ,11 Based on this definition, hardening would mean that an increased fraction of the population of smokers will not or cannot quit, which would be manifest as less quitting or quit attempts as prevalence decreases. This effect would be reflected as a neutral or negative association between the number of cigarettes smoked per day (CPD) by each remaining smoker, and smoking prevalence (ie, the same or more cig/day as prevalence declines). Hence, we examined the associations between (1) the proportion of smokers who made at least one quit attempt in the past 12 months and (2) the number of CPD among the remaining smokers (as dependent variables) and smoking prevalence (as the independent variable) over an 18-year period in the USA (state level), and a 6-year period in the European Union (country level). For the USA, we also analysed the association between quit ratios (dependent variable), the percentage of ever smokers who have quit, and prevalence. We found evidence of softening, not hardening, among remaining smokers as prevalence decreased over time.
Methods
Data
US state-level data for the years 1992/1993 through 2010/2011 (1992/1993, 1995/1996, 1998/1999, 2001/2002, 2003, 2006/2007 and 2010/2011) came from the Tobacco Use Supplement of the Current Population Survey (TUS-CPS), a monthly survey covering about 50 000 households, nationally representative of the US non-institutionalised population 15 years of age or older conducted by the US Bureau of the Census12 obtained from the Centers for Disease Control and Prevention State Tobacco Activities Tracking & Evaluation System.13 (We treat the District of Columbia as a ‘state,’ so we have observations for 51 states.) The smoking survey population is restricted to those 18 years and older. A smoker is defined as having smoked at least 100 cigarettes in their lifetime, and currently smoking every day or some days. Everyday smokers who had stopped smoking for 1 day or longer because they were trying to quit smoking during the past 12 months were defined as having made a quit attempt. Everyday smokers are asked how many cigarettes, on average, they smoke per day. The percentage of ever smokers who have quit (quit ratio) was calculated by dividing the number of former smokers by the number of current and former smokers (see online supplementary material for the exact questions).
Data on quit attempts were not available for Alaska for 2010/2011, for the District of Columbia for 2003, 2006/2007 and 2010/2011, for North Dakota for 2006/2007 and 2010/2011, for Vermont for 2010/2011 and for Wyoming for 2003 and 2010/2011. Data on cigarette consumption were not collected in 2003 or for the District of Columbia, North Dakota, Vermont and Wyoming in 2011/2012. Thus, we had a total of 348 data points over 18 years for quit attempts, and 302 data points for mean number of CPD. With data available for all time points and all states, we had 357 data points for quit ratios.
European data for 31 countries (Austria, Belgium, Bulgaria, Croatia, Republic of Cyprus, Turkish Cypriot Community, Czech Republic, Denmark, Estonia, Finland, France, Germany, Greece, Hungary, Ireland, Italy, Latvia, Lithuania, Luxemburg, Former Yugoslav Republic (FYR) of Macedonia, Malta, The Netherlands, Poland, Portugal, Romania, Slovakia, Slovenia, Spain, Sweden, Turkey, and the UK) came from the Eurobarometer (EB) survey between 2006 and 2012. The EB is collected on behalf of the European Commission with in-depth Special EB reports covering specific topics within regular EB polling waves. The survey uses a multistage sampling design with uniform instructions for all countries, aiming for a sample size of 1000 completed interviews per country with respondents aged 15 years or older14 We used data from 2006 (Special EB 272c/Wave 66.2,15), 2009 (Special EB 332/Wave 72.316), and 2012 (Special EB 385/Wave 77.117).
Although tobacco-related EB questions were also asked at other points in time, those surveys did not include information on prevalence, quit attempts and cigarette consumption, or these variables were measured in a way which did not allow for direct comparison with data collected in the other years. No published data on quit ratios was available in the EB reports.
The question assessing overall smoking prevalence asks whether the respondent was presently smoking cigarettes, cigars or a pipe, with multiple answers possible. Quit attempts in the previous 12 months were reported by those currently smoking cigarettes and/or pipes and cigars. The question about the exact number of cigarettes smoked daily (available for 2009 and 2012) was asked of respondents who indicated that they were either everyday or occasional cigarette smokers (see online supplementary material for exact questions).
Data on the exact number of cigarettes smoked were not collected for Europe in 2006, and data for FYR Macedonia and Turkey were only available for 2009, and Croatia and the Turkish Cypriot Community for 2006 and 2009. Thus, we had a total of 87 data points over 6 years for quit attempts and 58 data points over 3 years for the number of cigarettes smoked.
Statistical analyses
We pooled the data from these sequential cross-sectional studies to examine the association between the percentage of smokers who attempted to quit in the past 12 months, quit ratios, and the number of cigarettes smoked (in separate regressions for each outcome) as a function of smoking prevalence with a linear regression analysis that allowed for the slope and intercept of these associations to change linearly with time. Specifically, we fit all the data for the USA and Europe (separately) to the regression equation: where s is quit attempt prevalence, quit ratio or cigarettes per day, Prevalence is smoking prevalence, and ycentered=year of survey—mean year of all included surveys. Thus, b0 is the intercept of the association between the dependent variable and smoking prevalence, and bprev is the slope of the association between the dependent variable and smoking prevalence at the mean year the surveys were conducted (USA: 2001.57 for both quitting outcomes and 2001.33 for CPD, computed using the later years of surveys that spanned 2 years, eg, 2011 for 2010/2011; Europe: 2009 for quit attempts and 2010.5 for CPD) and bint and bslope quantify how much the slope and intercepts of these associations change each year.
We performed a residual analysis to ensure that the regression used was a good fit to the data. For the US models of quit attempts and CPD, the residual analysis led us to include a dummy variable controlling for the year 1995/1996 (not included in the formula above) which improved behaviour of the residuals. As noted by others,7 in the 1995/1996 survey, the reported quit attempt prevalences were unusually low.
We performed sensitivity analyses of the assumption that the slopes and intercepts vary linearly with time by entering year as a categorical dummy variable without any interactions.
Results
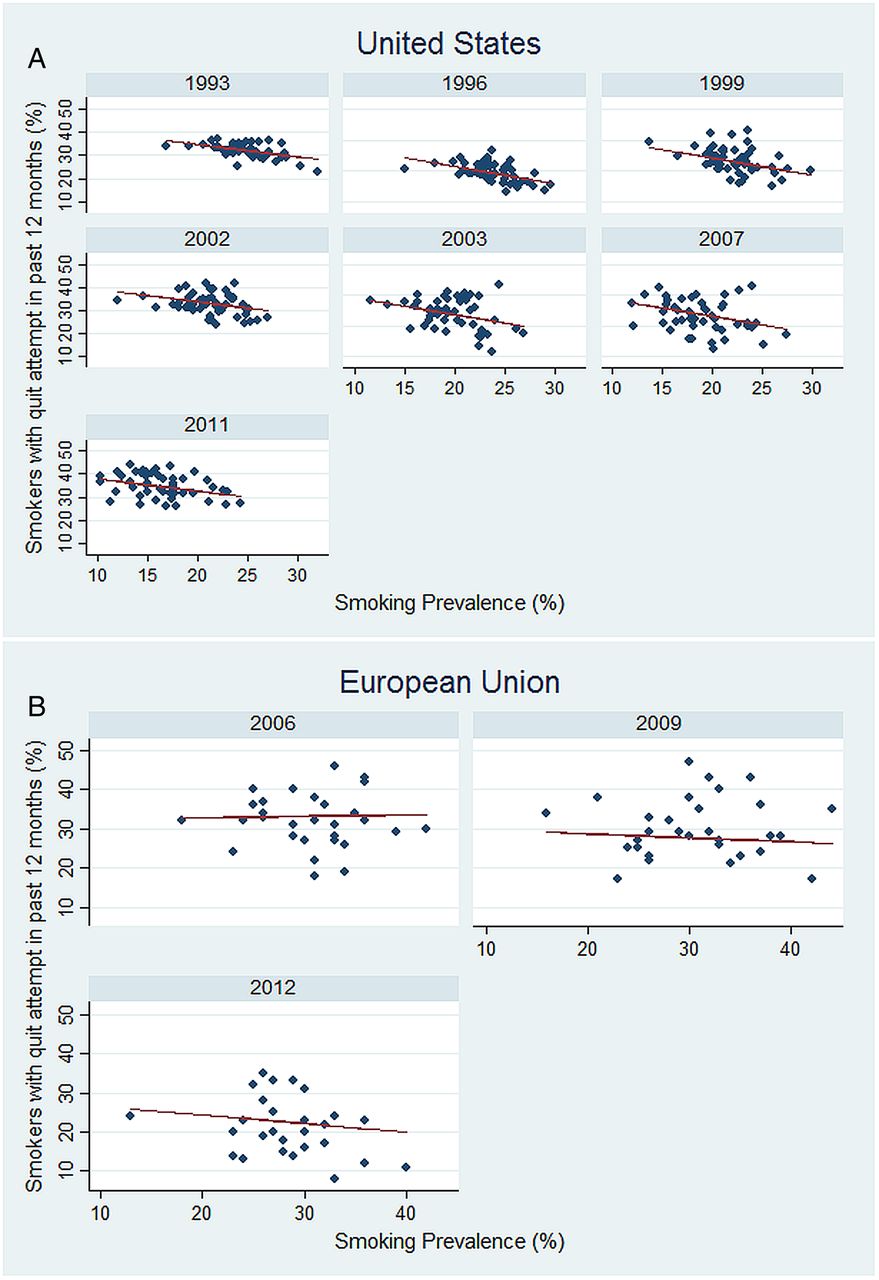
Figure 1 (A and B) shows the data by year; the lines on each panel in the figure correspond with the regression equation in table 1 that was fit using all years’ data for the USA and EU, in one regression for the USA and one for the EU. In the USA, as smoking prevalence decreased, more smokers made quit attempts (a 0.55% increase in prevalence of quit attempts for each 1.00% drop in smoking prevalence), and in the EU, quit attempts remained stable as prevalence declined, opposite of what the hardening hypothesis predicts. These associations were stable over time (bint and bslope were not significantly different from zero; p=0.45 and 0.87, respectively, in the USA; p=0.77 and 0.51, respectively in the EU). The absence of a significant interaction between time and smoking prevalence indicates that the slope of the relationship between smoking prevalence and quit attempts, as well as the relationship with most of the other outcomes, does not vary with time. This result means that the change in outcomes corresponding with a given change in the prevalence of smoking is stable over time.
Association between smoking prevalence and quit attempts, quit ratio, and cigarette consumption among continuing smokers (±standard error)

There were more quit attempts at lower smoking prevalence levels in the USA (A); quit attempts remained stable in the EU (B) as smoking prevalence declined. The regression lines on each panel correspond with the single regression equation in table 1 that was fit using all years’ data in the analyses for the USA or the EU.
Table 1 and figure 2 show that in the USA, the percentage of ever smokers who have quit (the quit ratio) increased with declining smoking prevalence. The quit ratio increased by 1.13% for each 1.00% decrease in prevalence with a stable association over time, consistent with softening. (As with figure 1 (A and B), the regression lines depicted for the different years’ data correspond with the regression obtained by analysing all years’ data.)
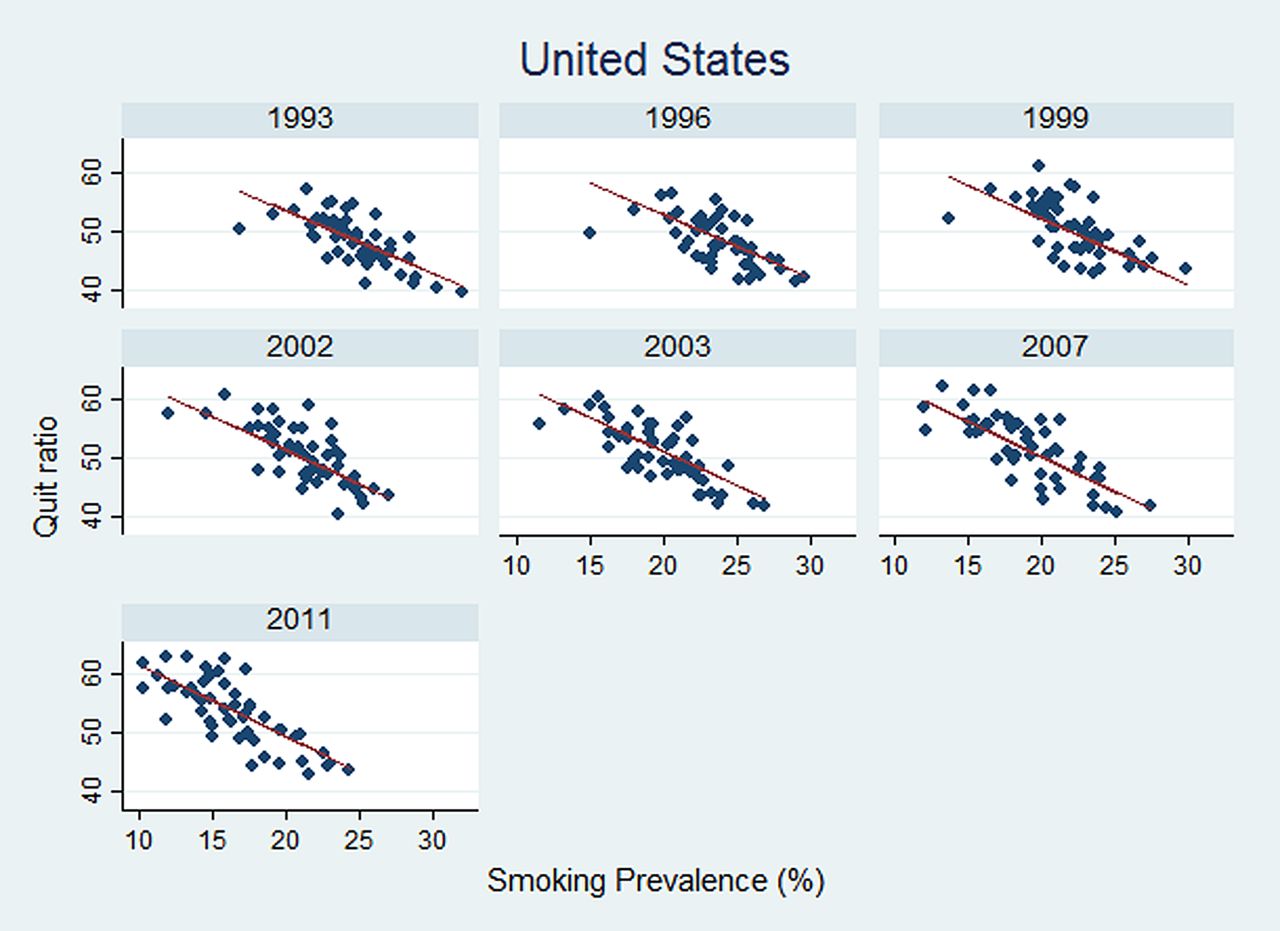
The quit ratio was consistently higher at lower levels of smoking prevalence in the USA. The regression lines on each panel correspond with the single regression equation in table 1 that was fit using all years’ data.
Table 1 and figure 3 (A and B) show significant positive associations between cigarette consumption and smoking prevalence in both the USA and EU, with fewer cigarettes smoked as prevalence drops, also opposite to what the hardening hypothesis predicts. (As with figures 1 (A and B) and 2, the regression lines depicted for the different years’ data correspond with the regression obtained by analysing all years’ data for the USA and the EU, in one regression for the USA and one for the EU.). In the USA, the association between cigarette consumption and smoking prevalence also shifted to lower levels of consumption over time (bint significantly negative).

Continuing smokers smoked fewer cigarettes per day at lower levels of smoking prevalence in the USA (A) and EU (B). The regression lines on each panel correspond with the single regression equation in table 1 that was fit using all years’ data in the analyses for the USA or the EU.
The results of the sensitivity analysis confirmed that there was not a non-linear effect of time, and that entering time as a continuous linear variable in the main analysis did not distort the results. The sensitivity analyses confirmed that the association between quitting and smoking prevalence remained negative. Quit attempts increased by 0.53% per 1% drop in smoking prevalence (±0.07 standard error, p<0.001) for the USA, and increased by 0.12%±0.14, p=0.41 for Europe. US quit ratios increased by 1.16% per 1% drop in smoking prevalence (±0.06, p<0.001). The association between the number of cigarettes smoked and prevalence continued to be positive with cigarettes per day decreasing by 0.32 cig/day±0.02, p<0.001 for each 1% decrease in smoking prevalence for the USA, and declining by 0.23 cig/day±0.05, p<0.001 for Europe.
Discussion
As smoking prevalence has declined over time, quit attempts and quit ratios increased in the USA, and quit attempts remained stable in the EU. (There are no published data on quit ratios for the EU.) The number of CPD declined as smoking prevalence declined in both regions. These associations are opposite to the hypothesis of hardening of the smoking population and, instead, support softening of the smoking population as prevalence declines.
Our results are consistent with and expand those found by Giovino et al18 who found positive associations between smoking prevalence and CPD among current smokers, and of National Cancer Institute's Smoking and Tobacco Control Monograph 15,19 which found a positive association between smoking prevalence and absence of cessation. In addition, Etter20 using data from the late 1990s found that lower prevalence of cigarette smoking was associated with a higher motivation to quit smoking, more quit attempts, and lower cigarette consumption among smokers. While Warner et al7 in an analysis of TUS-CPS data from the 1990s interpreted the decline in quit attempts on the overall US level between 1992/1993 and 1995/1996 to potentially mean hardening, the data they present for 1998/1999 show that quit attempts subsequently increased, indicating that the dip in the mid-1990s did not represent a trend. More important, the data through 2010/2011 (table 1) shows softening.
The many ways in which hardening can be measured in addition to our outcomes of choice, for example, also by using dependence scales or by assessing the success of given quit attempts, and the lack of a clear definition of what constitutes a ‘hardcore smoker’ can make the estimation of the size of this subgroup of smokers difficult, and could lead to varying conclusions about the hardening or softening of a smoking population. Some authors argue that in the USA, hardcore smokers make up only a very small part of the population, and that hardening in the general population is not (yet) in sight.9 ,21 ,22 ,23 Augustson and Marcus24 estimated that in 1998/1999, the percentage of hardcore smokers was as high as 13.7% nationally and 8.0% in California. European analyses have focused mostly on England and the assessment of the proportion of those who can be described as hardcore smokers. Jarvis et al25 estimated that in the mid-1990s the percentage of hardcore smokers in England was 16%, defined as daily smokers in the previous 5 years, without quit attempts in the past 12 months, and without desire or intention to quit. Also, for England between 2000 and 2010, Docherty et al26 suggest that hardening might have been occurring because the proportion of smokers with low motivation to quit and high degree of dependence increased, with an average of about 13% of smokers identified as hardcore smokers during this time. Even accepting these estimates, however, shows that the ‘hardcore’ is a small fraction of all smokers. The consistency of these estimates over time and places with widely varying smoking prevalence suggests that the absolute prevalence of more addicted smokers is decreasing as the overall smoking prevalence declines.
Because consumption (cig/day) among continuing smokers is likely being driven by such tobacco control policies as restrictions on where smoking is allowed, the question of whether the smoking population is hardening or softening has important implications for public health policy such as promoting smokeless tobacco27 or e-cigarettes.28 Meija et al29 showed that promoting smokeless tobacco as part of a harm reduction strategy in the USA would not be likely to lead to substantial health benefits at the population level when accounting for the possibility of dual use with conventional cigarettes. Likewise, Kalkhoran and Glantz (S Kalkhoran, SA Glantz. Health Impact of Alternative Futures for Expanding E-cigarette Sales: A Monte Carlo Analysis (submitted)) found that only in an optimistic case in which the dominant effect of promoting e-cigarettes would primarily lead to smokers switching to e-cigarettes with little dual use and youth initiation, would population health benefits be higher than in the status quo. The results presented here call into question the hardening hypothesis which is the core justification for promoting these products, and instead suggests that current tobacco control policies (smokefree policies, tobacco taxation, media campaigns, and, in Europe, advertising restrictions) have been leading to softening of the smoking population.
While there will always be more and less addicted smokers (with more addicted smokers being in the range of 8–16% of all smokers24 ,25 ,26), what the data show is that, over a long period of time, the smoking population is shifting to smokers who are making more quit attempts and consuming fewer cigarettes.
Over time, smokers are also becoming, on average, less educated and poorer, as well as more likely to have mental illness.30 ,31 ,32 ,33 The changing demographic characteristics of the remaining smokers may require a different mix of interventions, or at least differently targeted interventions, than in the past.
Limitations
All information used was self-reported. While it has been shown that cross-sectional surveys of self-reported smoking status are reliable sources of information on smoking behaviour over time,34 it is possible that with more and more stigma attached to smoking over time there might be increasing under-reporting of prevalence and the number of cigarettes consumed, in order to provide more socially acceptable answers.
Like earlier studies,20 ,24 this analysis is a pooled analysis of sequential cross-sectional surveys, not a longitudinal analysis of individual states and countries.
Jarvis et al35 found that cig/day has decreased among US smokers during the past 25 years, while cotinine levels have not, which suggests that there may be some compensating changes in smoking topography to compensate for lower cigarette consumption. While this finding might call in to question the use of cig/day as an indicator of nicotine dependence, it is not evidence for hardening.
Concerning the use of the quit ratio as one of our outcome variables, it is important to remember that we do not know when these people quit; the successful quit could have been at any point prior to the survey (not just the current year), so the relationship between quit ratios and prevalence is reflecting the integrated effects of the long-term changes we are documenting, not necessarily behaviour in a specific year.
Hughes,36 while suggesting that success among those who attempt quitting might be a more optimal measure than quit attempts, found that there was no evidence of a decreased ability to quit among the general US population in the 1990s. While we do not have data on the success of individual quit attempts we show that as prevalence declines both quit attempts and the quit ratio increase (in the USA, where we have data on quit ratio), which suggests that quit success is either stable or increasing.
There are some differences in the questions in the USA and the European surveys. ‘Smoking’ in the TUS-CPS means cigarette smoking, whereas in the EB it includes the use of cigarettes, cigars, and/or pipes. However, the percentage of those mentioning smoking cigars or pipes was very low. These differences are not an issue because we are not comparing the two regions but rather examining the trends within each region. The wording of the EB questions also differs slightly between the different years, but remains comparable. (We include the exact wording of the questions in the online supplementary material).
The population-level data used in this analysis do not include individuals who are institutionalised or homeless. It is, however, among at least some of the segments of such populations where disproportionately more and heavier smokers can be found.33 ,37 ,38 ,39 Hence, the surveys we use might not include a portion of those who would be characterised as hardcore smokers.
Conclusion
Our results reject the hypothesis of hardening as smoking prevalence drops and, instead, support softening of the smoking population. Tobacco control policies should continue to move the population down these softening curves rather than changing these policies to promote new forms of nicotine delivery.
What this paper adds
It has been argued that as smoking prevalence declines in countries, the smokers that remain include higher proportions of hardcore smokers who are unwilling or unable to quit.
This study shows that as smoking prevalence has declined, quit attempts and quit ratios increased in the USA, and quit attempts remained stable in the EU. The number of cigarettes smoked per day declined as smoking prevalence declined in both regions.
The population of remaining smokers has been softening, not hardening, in the USA and EU, as smoking prevalence has decreased over time.
Acknowledgments
The authors thank Kimp Walton for his help in providing details about the TUS-CPS data as available through the CDC's State Tobacco Activities Tracking & Evaluation database.
References
Supplementary materials
Supplementary Data
This web only file has been produced by the BMJ Publishing Group from an electronic file supplied by the author(s) and has not been edited for content.
- Data supplement 1 - Online supplement
Footnotes
Contributors MCK collected the data, computed the statistics, and drafted the manuscript. SAG advised on data analysis and revised the manuscript.
Funding This research was funded by National Cancer Institute Grants CA-113710 and CA-060121. The funding agency played no role in the conduct of the research or preparation of the manuscript.
Competing interests None declared.
Provenance and peer review Not commissioned; externally peer reviewed.
Data sharing statement This paper is based on public use data sets.