Article Text

Abstract
Objective There is growing international interest in advancing ‘the tobacco endgame’. We use New Zealand (Smokefree goal for 2025) as a case study to model the impacts on smoking prevalence (SP), health gains (quality-adjusted life-years (QALYs)) and cost savings of (1) 10% annual tobacco tax increases, (2) a tobacco-free generation (TFG), (3) a substantial outlet reduction strategy, (4) a sinking lid on tobacco supply and (5) a combination of 1, 2 and 3.
Methods Two models were used: (1) a dynamic population forecasting model for SP and (2) a closed cohort (population alive in 2011) multistate life table model (including 16 tobacco-related diseases) for health gains and costs.
Results All selected tobacco endgame strategies were associated with reductions in SP by 2025, down from 34.7%/14.1% for Māori (indigenous population)/non-Māori in 2011 to 16.0%/6.8% for tax increases; 11.2%/5.6% for the TFG; 17.8%/7.3% for the outlet reduction; 0% for the sinking lid; and 9.3%/4.8% for the combined strategy. Major health gains accrued over the remainder of the 2011 population’s lives ranging from 28 900 QALYs (95% Uncertainty Interval (UI)): 16 500 to 48 200; outlet reduction) to 282 000 QALYs (95%UI: 189 000 to 405 000; sinking lid) compared with business-as-usual (3% discounting). The timing of health gain and cost savings greatly differed for the various strategies (with accumulated health gain peaking in 2040 for the sinking lid and 2070 for the TFG).
Conclusions Implementing endgame strategies is needed to achieve tobacco endgame targets and reduce inequalities in smoking. Given such strategies are new, modelling studies provide provisional information on what approaches may be best.
- tobacco endgame
- simulation model
- smoking prevalence
- QALYs
- health system costs
Statistics from Altmetric.com
Introduction
There is growing international interest in advancing the final stage of the tobacco pandemic, that is, ‘the tobacco endgame’.1 A number of countries—New Zealand, Sweden, Ireland and multiple Pacific Island Nations—aim to achieve their respective tobacco endgames by 2025. Some other jurisdictions have different end dates (eg, Denmark 2030, Scotland 2034, Finland 2040), or are exploring novel ways of accelerating progress towards reducing smoking without a specific target date. A recent case was made for the adoption of a global tobacco endgame goal for 2040—a world ‘where less than 5% of the adult population use tobacco’.2 While a number of countries have made significant progress in reducing smoking prevalence in recent decades, for the vast majority of countries achieving endgame goals most likely requires intensified beyond business-as-usual (BAU) action.2–4
A range of innovative strategies have been proposed to accelerate progress towards reducing smoking prevalence, and ultimately towards eliminating tobacco-related morbidity and mortality,1 5 but there has been little research estimating the impact of endgame strategies on future smoking prevalence, population health and health system costs. Quantifying these effects and the associated uncertainty could guide endgame decision making.
The aims of this study were to quantify the future prevalence, health and cost impacts of five tobacco endgame strategies using New Zealand as a case study. A continuation of past trends in smoking uptake and cessation (BAU) served as the comparator. The endgame strategies were ongoing annual tobacco tax increases (an established part of tobacco control in New Zealand since 2010), the tobacco-free generation (TFG) strategy6 (a ban on the provision of tobacco to those born from a set year onwards), a sinking lid on tobacco supply (involving regular reductions in the amount of tobacco supplied to the commercial market until supply ends),7 and a substantial reduction in the number of tobacco retail outlets given the observed association between increased tobacco retail outlet proximity and density with reduced cessation, and increased smoking uptake and relapse.8
We examined how time delays to health gains (and cost savings) differ between such strategies, a pattern that should be generalisable to other countries given tobacco-related diseases largely occur at middle and older ages. New Zealand also provides a setting with heterogeneity of smoking prevalence by demographic groups with Māori (indigenous population) having much higher smoking rates than non-Māori (34.7% vs 14.1%) and higher tobacco-related non-communicable disease rates, providing two ‘separate’ population groups to model and an assessment of social disparity impacts of potential endgame strategies.
Although some of the proposed tobacco endgame strategies have received a considerable amount of political and/or media attention, there is no country in the world that has actually implemented any of these strategies. Simulation models can therefore be used as virtual social laboratories to explore what might happen in advance to implementation of novel policies,9 10 a role that has been emphasised to guide tobacco endgame planning.8
Methods
Two simulation models were used to estimate smoking prevalence, health and cost impacts of selected tobacco endgame strategies: (1) a dynamic population forecasting model to project future smoking prevalence (see11–14 for a more detailed description of the model) and (2) a multistate life table model (see15 16 for a more detailed description) to estimate future population health outcomes and health system costs (using the former estimated future prevalence).
Future smoking prevalence
A ‘base component’ estimated recent annual trends in smoking uptake and cessation by sex, age and ethnicity (Māori and non-Māori).14 These rates were then used as inputs for the ‘forecasting component’ to project future smoking prevalence beyond 2011, for BAU and for the additional prevalence reductions from endgame strategies. Model parameters are in online supplementary table S1.
Supplementary material 1
Future health and health system costs
An established model15 16 in Microsoft Excel was used to estimate the impacts of tobacco control interventions on future population health (in quality-adjusted life-years (QALYs) and health system costs (in 2011 NZ$) for the New Zealand population alive in 2011 (4.4 million), until death or age 110 years. Model parameters are in online supplementary table S2.
All simulated population members were exposed to projected all-cause mortality and morbidity rates specified by sex, age and ethnicity. The main life table was connected to 16 tobacco-related disease life tables (11 cancers and a number of cardiovascular and respiratory diseases15) where proportions of the population simultaneously resided. Health system costs were from a detailed national dataset.15 16
The effect of selected tobacco endgame strategies was modelled through changes in smoking uptake and cessation compared with BAU, and thence varying future smoking prevalence. This change was mathematically combined with relative risks for smoking-incidence rate ratios to generate population impact fractions (PIFs; 1−PIF = proportional reduction in future tobacco-related disease incidence), which consequently altered the inflow of the population through to the tobacco-related disease life tables. The cost of the selected tobacco endgame strategies was considered to be the previously estimated costs of a new law in New Zealand (NZ$3.54 million).17 QALY gains and net health system costs were discounted at 3% per year, but findings are also presented at 0% and 6% discount rates (with the results for the latter scenario presented in the online supplementary information).
Specification of the tobacco endgame strategies
Intervention input parameters, uncertainty and scenario analyses are summarised in table 1, and described below. Additional details around intervention specification, rationale and assumptions can be found in the online supplementary information.
Intervention input parameters for the selected tobacco endgame interventions
Annual tobacco tax increases
A continuation of the previous New Zealand strategy of 10% annual tobacco tax increases (as used since 2010) was assumed to 2025, after which the level of tax was held constant. Age-specific and ethnicity-specific tobacco price elasticities were used to estimate changes in future smoking prevalence, and thence population health and health system costs.15
The TFG strategy
This strategy assumed a law change prohibiting the sale and supply of tobacco18 to all individuals born from the year 1993 onwards, meaning that 18 year olds in 2011 (and all younger cohorts) would never be able to legally access tobacco. As such, annual smoking uptake rates were set to 0% from 2011 onwards.
A sinking lid on tobacco supply
A new law required tobacco companies from 2011 onwards to annually reduce the amount of tobacco imported into the country until commercial supply would end in 2025 (in line with New Zealand’s Smokefree goal). The total number of tobacco cigarettes supplied to the commercial market in 2011 was reduced by 10% absolute percentage points per year in the first 5 years, and by 5.6 percentage points per year in the remaining 9 years (50%/9). It was assumed that 50% of the yearly reduction in supply was met by people reducing the number of cigarettes consumed per day, and 50% by people quitting smoking (an approximate ratio based on the international literature around tobacco tax increases).19 Year-specific reductions in numbers of smokers were derived by taking into account tobacco demand of the previous year and the actual amount supplied in the current year (see table 1).
A substantial tobacco outlet reduction strategy
This strategy assumed a new law that mandated a tobacco retail licensing system as well as a reduction in the number of licences (determined by auction with outlets in the most densely populated areas (with the highest turnover) being more likely to be successful). In the first 9 years, the number of outlets reduced by 90% within each of the 66 local government areas (territorial local authority (TLA)) from 5979 outlets in 2011 to 593 outlets in 2020; 50% in the first year and a further 5% each year thereafter. In the second phase of the intervention covering the last 5 years of the phase in, remaining licences within each TLA reduced more substantially by linking the quota of licences to population size20 (based on the case of Hungary21although to a different degree). In 2021, TLAs with a population size of 10 000 or above were granted one licence (in other TLAs all remaining licences expired). Each year, the minimum population size required to keep a licence incrementally increased by 10 000 until this equaled 50 000 in 2025 (meaning a total of 18 outlets remaining, see online supplementary figure 1). The differences in ethnicity-specific baseline and intervention travel costs (both running cost and a valuation of travel time), for a return trip from the population-weighted centroid of 1542 Census Area Units (CAU; 1542 across New Zealand) to the nearest tobacco retail outlet, were treated as annual increases in the costs of a pack of 20 cigarettes. Tobacco prevalence price elasticities by age and ethnicity were then used to estimate the prevalence, health and cost impacts in both models (see13 16 for more details around methods).
Combined tobacco endgame strategy
For this intervention, the effects of 10% tobacco tax increases, the TFG strategy and the substantial tobacco outlet reduction strategy were combined. As such for this combined endgame strategy, the annual smoking uptake rates were first of all set to zero (TFG strategy). The incremental travel cost increases (arising from people having to travel further to purchase tobacco under the substantial outlet reduction strategy) were together with the price rises incurred by the annual tax increases added to the price of tobacco, and modelled directly onto the (TFG strategy induced) reduced smoking prevalence via ethnicity- and age-specific tobacco price elasticities.
Uncertainty and scenario analyses
There is substantial uncertainty around future BAU and the impact of tobacco endgame interventions, though for some such as regular tobacco tax increases there is empirical evidence (observed response to price increases in the past). Where possible we specified uncertainty about model input parameters based on the literature. Where uncertainty was unknown, we used the following approach: a SD of ±5% for reasonably certain variables (eg, incidence rates of diseases at baseline), ±10% SD for moderately uncertain variables (eg, costs) and ±20% SD for more uncertain variables (eg, price elasticities, BAU uptake and cessation rates, proportionate split between ‘cutting down’ and ‘quitting’ in demand reduction from supply reductions). All strategies were simulated 2000 times in Monte Carlo simulation, drawing from the probability density function about parameters as specified in table 1 (and see online supplementary tables S1, S2). This number of iterations provided stability of the central estimates and the upper and lower uncertainty limits, and has also been used in our previous modelling work.15 16 There is also uncertainty related to structural assumptions about the modelled strategies; where possible we addressed these with scenario analyses as described in table 1.
Results
Projected smoking prevalence
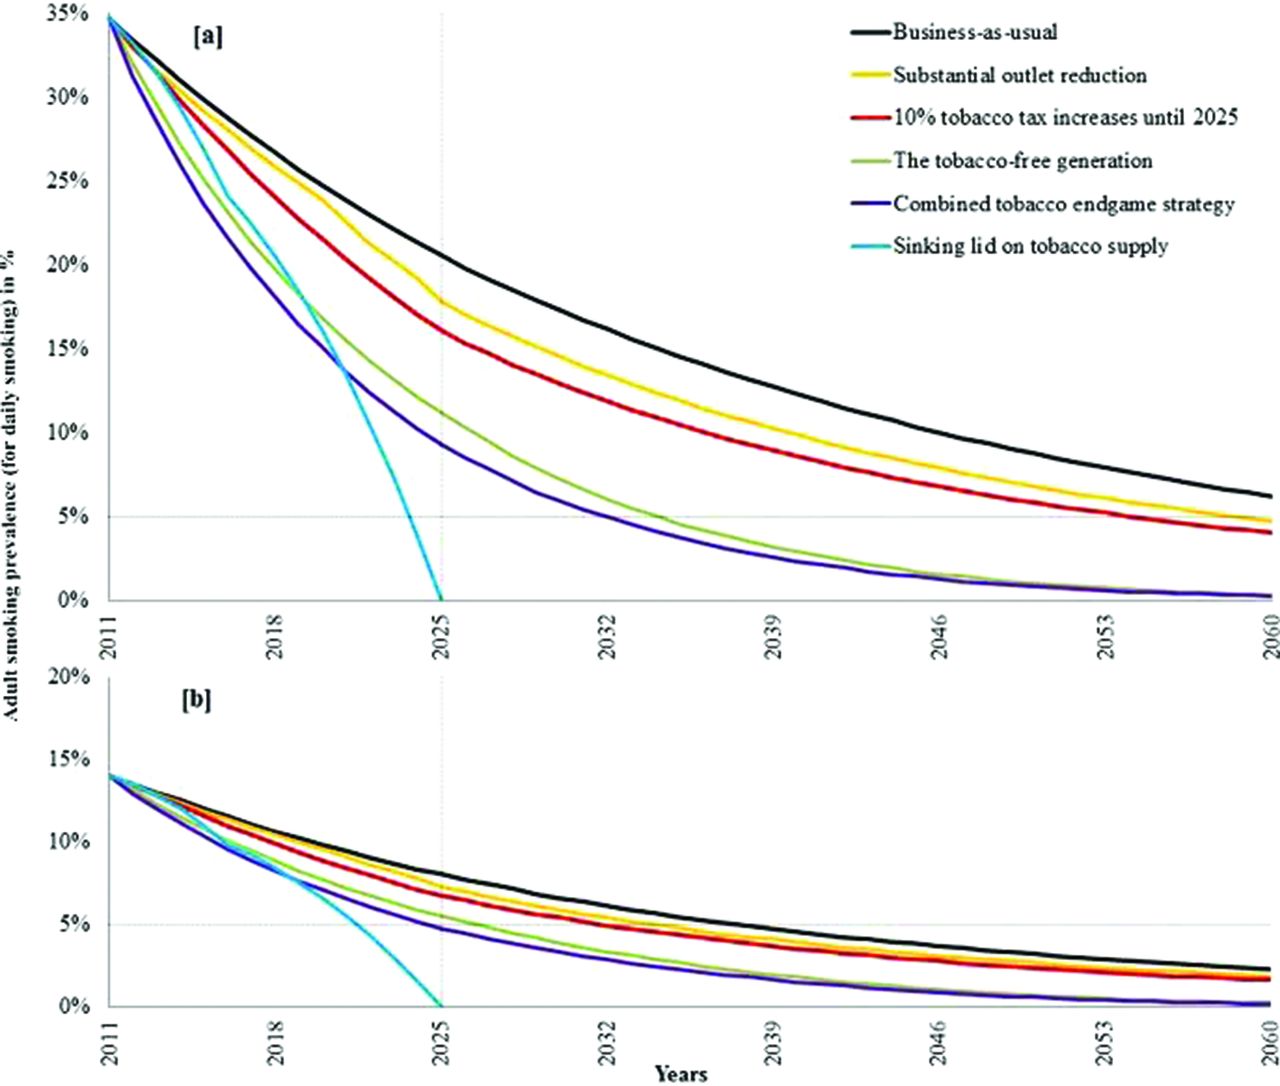
BAU trends in initiation and cessation rates were projected to see smoking prevalence reduce from 14.1% in 2011 to 8.1% (95%UI: 6.4% to 10.3%) in 2025 for non-Māori, and from 34.7% to 20.5% (95%UI: 16.8% to 25.2%) for Māori (figure 1 and table 2). By definition, the sinking lid achieves close to 0% by 2025 (due to legal commercial supply ending that year). Other endgame strategies had more intermediary impacts, with non-Māori/Māori prevalence in 2025 of 7.3%/17.8% for outlet reduction; 6.8%/16.0% for tax; 5.6%/11.2% for the TFG strategy; and 4.8%/9.3% for a combination of outlet reduction, tax and the TFG strategy. Ethnic inequalities in smoking prevalence reduced (table 2), for example, from a gap of 12.5 percentage points in 2025 under BAU to 4.5 percentage points under the combined strategy.

Projections of adult daily tobacco smoking prevalence for Māori in New Zealand (indigenous population) (a) and non-Māori (b) under BAU and five tobacco endgame strategies. (Note: As can be seen from the above figures, the effect of the combined tobacco endgame strategy on future smoking prevalence is smaller than the sum of the effects of the three individual endgame strategies (tax, outlet reduction and TFG strategy). Due to the TFG strategy, smoking uptake among young people is completely prevented from 2011 onwards, as such the effect of the outlet reduction and tax strategies will no longer affect the younger population of the 2011 cohort. TFG, tobacco-free generation).
Projected future tobacco smoking prevalence for 2025 by ethnicity under a business-as-usual (BAU) scenario and for the selected tobacco endgame strategies (adults, daily smoking prevalence (SP) and ordered by increasing strategy effectiveness)
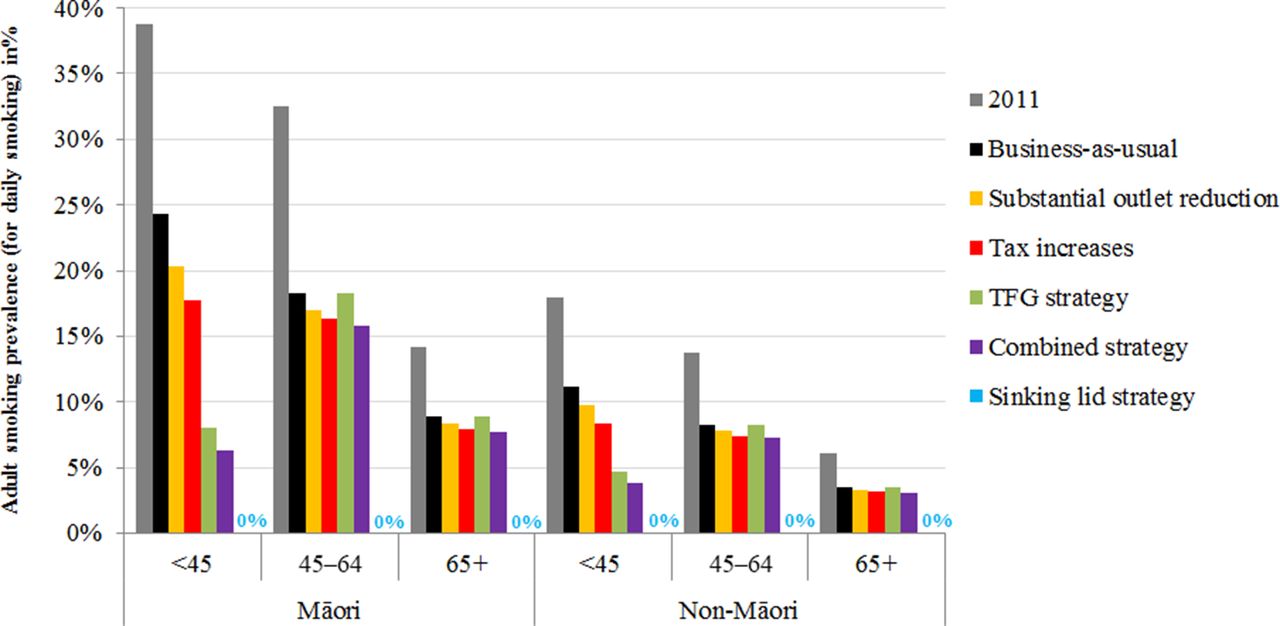
The TFG strategy achieved a halving of smoking prevalence by 2025 for those aged 44 years and younger compared with BAU, but not for older ages. In contrast, the outlet reduction, tax, combined and sinking lid strategy would affect the population across the age spectrum (figure 2). Adding tax and substantial outlet reductions to the TFG strategy (combined strategy) resulted in marginal reductions in smoking prevalence in older age cohorts compared with BAU.

Adult daily tobacco smoking prevalence by ethnic and age groups in 2011 and projected to 2025 for selected tobacco endgame strategies. TFG, tobacco-free generation.
Allowing for some continued smoking uptake by the TFG cohort (at 20% of BAU trends due to potential social and illegal supply) resulted in a slight lift in 2025 smoking prevalence estimates (eg, from 11.2% to 13.1% for Māori and from 5.6% to 6.1% for non-Māori for the TFG strategy alone, and from 9.3% to 10.4% and 4.8% to 5.1% for the combined strategy). These and other optimistic and pessimistic scenarios (eg, allowing for a growing illicit market higher tax increases, halving price elasticities, etc) for each tobacco endgame strategy are in online supplementary table S3; none of the scenario analyses substantively altered the patterns observed in table 2.
Future population health and health system costs
All endgame interventions were projected to generate substantive health gain and cost savings over the remainder of the 2011 New Zealand population’s life, ranging from 28 900 QALYs gained for outlet reduction (95%UI: 16 500 to 48 200) to 282 000 QALYs for the sinking lid (95%UI: 189 000 to 405 000) (table 3). Additionally, all endgame interventions reduced ethnic inequalities in health, ranging from 3.3 times more health gain per capita for Māori alive in 2011 compared to non-Māori for the sinking lid strategy to 5.6 times for the TFG strategy (see online supplementary tables S1-S8). Cost savings ranged from NZ$584 million (95%UI: $NZ328 million to NZ$985 million; substantial outlet reduction) to NZ$5430 million (equivalent to £2560 million, US$3650 million and €2850 million) (95%UI: NZ$3640 million to NZ$7960 million; sinking lid).
Total population health gains (in QALYs gained) and health system cost savings (in NZ$) for the five tobacco endgame interventions compared with BAU over the remainder of the 2011 NZ population’s lifetime at 3% and 0% discounting*, and % QALYs gained and costs saved by 2025, 2040, 2055 and 2070
Only minor fractions of total health gain and cost savings were accrued by 2025 for all strategies (table 3). Beyond 2025, the timing of health gain and cost savings differed greatly by endgame strategy (see online supplementary figure S2). For the sinking lid strategy, 18% of all health gain and 35% of all cost savings were achieved by 2040, compared with only 6% and 10%, respectively, by 2040 for the TFG. By 2070, over 95% of cost savings accrued for the sinking lid versus 85% for the TFG strategy.
Assuming a ‘spill-over effect’ of the TFG on adult smoking behaviour (through further denormalisation of tobacco smoking) resulted in increased health gain and cost savings (and a minor shift in the timing thereof). These and other optimistic and pessimistic scenarios for each of the endgame interventions are presented in online supplementary table S10. Under no scenario were any of the endgame interventions projected to increase net health system costs or not generate QALY gains.
Discussion
Main results and interpretation
A continuation of BAU trends in smoking uptake and cessation in this modelled high-income country population is unlikely to achieve an endgame goal of below 5% smoking prevalence by 2025. Our modelling suggests that the selected endgame strategies could accelerate progress towards reducing smoking prevalence to minimum levels, and further reduce absolute ethnic inequalities in smoking. Yet, apart from the sinking lid on supply, none of the other endgame strategies was able to achieve <5% smoking prevalence by 2025 for both Māori and non-Māori. All endgame strategies did result in large health gains and cost savings to the health system, especially so for Māori. However, the timing of such health gain and cost savings differed greatly by strategy—the TFG strategy health gains and cost savings are many decades away given it is young smokers affected, while a strategy like the sinking lid realises health gains and cost savings sooner.
While this study explored tobacco endgame strategies for just one country’s tobacco endgame goal (2025 for New Zealand), it likely provides generalisable patterns and timing of impacts from these strategies for other countries with different endgame target dates. Moreover, for countries with large social inequalities in smoking prevalence and non-communicable disease rates, the pattern of inequality reduction we estimate should be fairly generalisable. Constraints on generalisability to other countries include that New Zealand has no significant domestic tobacco growing, does not share land borders with other countries and it has good border controls that limit tobacco smuggling. Nevertheless, even assuming an increase in the illicit tobacco market (eg, up to 15% under the combined strategy) did not substantively alter results.
Strengths and limitations of this study
To our knowledge, this is the first study that has attempted to quantify the impacts of a range of proposed endgame strategies simultaneously on future smoking prevalence, and (the timing of) future health gain and cost savings to the health system. This was enabled by using two established peer-reviewed tobacco computer simulation models using rich local epidemiological and health system costing data, and smoking prevalence data from national censuses.
Nevertheless, projecting future impacts of public health interventions is inherently uncertain.22 Conveying uncertainty around model predictions is crucial where there is limited evidence on the effectiveness of policies (as with the non-tax endgame interventions in this study). Generous uncertainty was specified about most model and intervention parameters, and wide-ranging scenario analyses were run (to test the sensitivity of model estimates under even more extreme changes in parameter values). Yet, it is likely that the ‘true uncertainty’ around parameters is even wider than presented here. Importantly, we did not model legalisation of nicotine-containing e-cigarettes as these are at present not legal to sell in New Zealand. Nevertheless, modelling work on this topic is in progress as legalising e-cigarettes could synergistically enhance endgame strategies such as those modelled in this paper as a ‘substitute’ nicotine source is available. In addition, not taking into account the potential synergy of the three major endgame policies in the combined scenario through their cumulative impact on social norms around smoking (and their reinforcing effects on not taking up or quitting smoking) may have resulted in an underestimation of the ‘true’ prevalence, health and cost impacts. Even so, major uncertainties remain about both direct harms of e-cigarettes and to what extent (further) tobacco denormalisation would occur as a result of the implementation of (a combination of) endgame strategies.23 Future availability of such evidence could further improve accuracy of modelling work that projects the future prevalence, health and cost impacts of tobacco endgame strategies.
More specific limitations around our modelled interventions include the historic price elasticities used in this study; there is some evidence that price elasticities might increase at higher price levels of tobacco.24 While consumer behaviour theory25 26 and survey research27 28 support that increased travel costs to purchase tobacco can be assumed to be similar to an increase in the cost of tobacco, it remains unknown whether price elasticities for changes in travel costs are different from price increases arising from tax. A recent Finnish study, though, suggests that small increases in the distance from home to the nearest tobacco retail outlet may induce quitting,29 offering some support for our modelling.
Conclusions
Substantive and novel tobacco endgame strategies will probably be needed if countries are to achieve tobacco endgame targets. Although the evidence supporting these endgame strategies is not complete, this work provides modelling-level evidence that countries using them might achieve large health gains, realise large health system cost savings and reduce health inequalities associated with the tobacco-related disease burden. As empirical evidence on the effectiveness of endgame interventions arises (eg, Tasmania30 and Russia31 are exploring the TFG strategy, and Hungary substantially reduced the number of outlets),21 modelling undertaken in this study can be further validated and improved on.
What this paper adds
There is growing international interest in advancing the final stage of the tobacco pandemic, that is, ‘the tobacco endgame’. A range of novel strategies have been proposed to help achieve this goal. Yet, quantitative evidence on the impacts of ‘tobacco endgame strategies’ on future smoking prevalence, population health and health system costs is limited.
This appears to be the first study to simultaneously explore the potential future impacts of a suite of substantive ‘tobacco endgame strategies’ that have been proposed in the literature: a sinking lid on supply, the tobacco-free generation strategy, continuous tax increases, a substantial tobacco retail outlet reduction strategy and a combination of the latter three.
Substantive and novel tobacco endgame strategies will probably be needed if countries are to achieve tobacco endgame targets. Although the evidence supporting these endgame strategies is not complete, this work provides modelling-level evidence that countries using them might achieve large health gains, realise large health system cost savings and reduce health inequalities in the burden from tobacco.
Acknowledgments
We thank Dr Amber Pearson for her work and advice that have contributed towards the development of the multistate life table model and methods to estimate changes in travel distances, time and costs.
References
Footnotes
Contributors FSvdD led the writing, intervention specification, adaptation of the established models, analyses and extraction and interpretation of the results. LJC and TB conceived the core aspects of the modelling approach for the BODE3 tobacco forecasting model and the BODE3 multi-state life-table model, but with design contributions from FSvdD for the first model, and from CLC, GK, FSvdD, NN and NW for the latter model. All authors provided advice during analyses, and contributed towards the interpretation of results and drafting of the paper. All authors approved the final manuscript.
Funding FSvdD is supported by a University of Otago Doctoral Postgraduate Publishing Bursary. NW, CLC, GK, LJC, NN and TB are supported by the BODE3 Programme which is studying the effectiveness and cost-effectiveness of various health sector interventions and receives funding support from the Health Research Council of New Zealand (Grant number 10/248).
Competing interests None declared.
Provenance and peer review Not commissioned; externally peer reviewed.
Correction notice This paper has been amended since it was published Online First. Owing to a scripting error, some of the publisher names in the references were replaced with ’BMJ Publishing Group'. This only affected the full text version, not the PDF. We have since corrected these errors and the correct publishers have been inserted into the references.