Article Text

Abstract
Objective To systematically review the price elasticity of demand of non-cigarette tobacco products.
Data sources Medline, Embase, EconLit and the Web of Science without language or time restrictions.
Study selection Two reviewers screened title and abstracts, then full texts, independently and in duplicate. We based eligibility criteria on study design (interventional or observational), population (individuals or communities without geographic restrictions), intervention (price change) and outcome (change in demand).
Data extraction We abstracted data on study features, outcome measures, statistical approach, and single best own- and cross-price elasticity estimates with respect to cigarettes. We conducted a random effects meta-analysis for estimates of similar product, outcome and country income level. For other studies we reported median elasticities by product and country income level.
Data synthesis We analysed 36 studies from 15 countries yielding 125 elasticity estimates. A 10% price increase would reduce demand by: 8.3% for cigars (95% CI 2.9 to 13.8), 6.4% for roll your owns (95% CI 4.3 to 8.4), 5.7% for bidis (95% CI 4.3 to 7.1) and 2.1% for smokeless tobacco (95% CI −0.6 to 4.8). Median price elasticities for all ten products were also negative. Results from few studies that examined cross-price elasticity suggested a positive substitution effect between cigarette and non-cigarette tobacco products.
Conclusions There is sufficient evidence in support of the effectiveness of price increases to reduce consumption of non-cigarette tobacco products as it is for cigarettes. Positive substitutability between cigarette and non-cigarette tobacco products suggest that tax and price increases need to be simultaneous and comparable across all tobacco products.
- economics
- hand-rolled/ryo tobacco
- non-cigarette tobacco products
- price
- taxation
Statistics from Altmetric.com
Introduction
Tobacco use is estimated to kill 6 million people per year1 and its global economic cost, in terms of health expenditure and loss of productivity in 2012 was estimated at US$1436 billion.2 Taxation has repeatedly been shown to be an effective policy to reduce both tobacco initiation and to promote cessation.3–5 A modelling study has demonstrated that tobacco taxation averted 7.0 million smoking-attributable deaths worldwide between 2007 and 2014.6
Tobacco companies usually pass increased taxation onto consumers, however the manner in which this is done (such as increasing prices only for the most expensive cigarettes) may undermine public health goals.7 8 Higher prices exert their effect by lowering tobacco prevalence and by lowering tobacco consumption among those who continue to use. The size of these effects is often expressed as a price elasticity, a unitless number defined as the percentage change in consumption that results from a 1% price increase. For example, the price elasticity of cigarettes is −0.4 for high-income countries,1 indicating that a 10% increase in price results in a 4% relative reduction in cigarette consumption.
A strong evidence base exists for the effect of price on cigarette consumption, however, it is unclear as to how other tobacco products respond to price. There are several markets where, in addition to cigarettes, a wide range of tobacco products are commonly used. Non-cigarette tobacco products are much cheaper than cigarettes, partly due to lower level tobacco tax on those products relative to cigarettes.9 For example, India has an extremely diverse tobacco market where bidis are as prevalent as manufactured cigarettes.10 In many Middle Eastern countries, the prevalence of waterpipe tobacco exceeds cigarette prevalence.11 Between 2000 and 2013 in the USA, the value of cigarette shipments declined by about $10–$31.4 billion, while the value of non-cigarette tobacco products almost doubled from $4 to $7.7 billion.12
The public health impact of these non-cigarette products are of concern: smokeless tobacco has been estimated to contribute to over 260 000 deaths per year worldwide,13 cigar smoking has been associated with cancers of the lung, oesophagus, larynx and oral cavity, and waterpipe smoking has been associated with several cancers as well as respiratory disease, cardiovascular disease and low birth weight.14
Understanding how price affects the demand for non-cigarette tobacco products was identified as a key research need according to the 2017 National Cancer Institute Tobacco Control Monograph The Economics of Tobacco and Tobacco Control.1 This study summarises the evidence on the price elasticity of non-cigarette tobacco products.
Methods
Our protocol is registered on PROSPERO (CRD42014009351) and can be found at http://bit.ly/2jKcxdE.
Eligibility criteria
Our inclusion criteria included:
Publication type: all publication types, including but not limited to peer-reviewed journals, book chapters, working papers, and governmental or non-governmental reports.
Study design: intervention studies (randomised controlled trials, non-randomised trials and time series) and observational studies (eg, interrupted time series, cohort and cross-sectional studies).
Population: individuals, groups or communities regardless of geographic coverage.
Intervention: change in tobacco price or taxation.
Outcomes of interest: change in consumption of non-cigarette tobacco products, as described by a price elasticity of demand coefficient, and or a cross-price elasticity of demand coefficient with respect to cigarettes (ie, a change in cigarette consumption following a price or tax change in non-cigarette tobacco products).
We defined ‘non-cigarette tobacco products’ as any tobacco product other than manufactured cigarettes that contains tobacco or nicotine. This definition therefore included roll your owns, electronic cigarettes and therapeutic nicotine in addition to a variety of other non-cigarette tobacco products (eg, cigars, smokeless tobacco, waterpipes and so on). We excluded studies that did not distinguish non-cigarette tobacco products from manufactured cigarettes, studies that used broad tobacco product terms such as leaf tobacco and cut tobacco, and studies that measured elasticity through demand purchase tasks.
Search strategy
The full search strategy can be found in the online supplementary appendix 1. In November 2017, we searched the following electronic databases with no language restrictions: MEDLINE (1950 onwards), EMBASE (1947 onwards), EconLit (1971 onwards) and the Web of Science (1970 onwards). We used synonyms and spelling variations of non-cigarette tobacco products, including smoked tobacco products (eg, cigars, pipe tobacco and bidis) and smokeless tobacco products (eg, snus, gutkha and zarda). We also searched for related nicotine replacement products which could play an important complementary or substitute role with non-cigarette tobacco products, such as electronic cigarettes and therapeutic nicotine. In addition, we hand-searched the citation lists of included studies and of review articles and used the Google Scholar function to find articles that cited relevant studies. We contacted authors of potentially eligible studies to ask for any unpublished research studies that could fulfil our eligibility criteria.
Supplemental material
Selection process
Two reviewers (MJ and JTL) screened in duplicate and independently the title and abstract of captured citations to identify potentially eligible studies. We retrieved full texts of studies considered potentially eligible by at least one reviewer. The same two reviewers then screened in duplicate and independently the full texts using a standardised and pilot-tested screening form. Inter-reviewer reliability was 0.86. They resolved disagreements by discussion.
Data abstraction
One reviewer (MJ) independently abstracted data from each eligible study using a standardised and pilot-tested data abstraction form, which was checked by a second reviewer (JTL). They resolved disagreements by discussion and when needed with the help of a third reviewer (CM). We abstracted (1) metadata (author, year of publication); (2) study features (country, region (defined by the World Bank15), time period, design, demand data source, price type, price/tax data source and population); (3) statistical approach (model type, unit of consumption, the presence of adjustments for income (or another suitable measure of economic activity such as unemployment), cigarette price, tobacco policy and sociodemographic data) and (4) own-price elasticity values and cross-price elasticity values with respect to cigarettes.
We sought to abstract a single best elasticity estimate for each product from each study, prioritised based on the model with the best fit that possessed the highest explanatory power, followed by the fully adjusted model, then the partially adjusted model. If the specific model used was unclear or not reported, we contacted authors for clarification. If studies reported more than one elasticity estimate based on different tobacco consumption measures (eg, cross-sectional studies where both participation of use and intensity of use may be measured), we abstracted the single best elasticity estimate for each. Further, if studies only reported stratified elasticity estimates (eg, by population characteristic) without an overall estimate, we abstracted each estimate separately.
Data analysis
We conducted random effects meta-analysis where we had at least three products of the same type, using the same outcomes measure (quantity consumed, participation and intensity of use among users only), from the same country income level (high or low–middle) and where 95% CIs were reported, or where t-statistics or standard errors were presented that allowed calculation of the CIs. For these and all other studies, we reported elasticity medians with minimum and maximum estimates for each outcome measure, stratified by country income level.
Results
Description of included studies
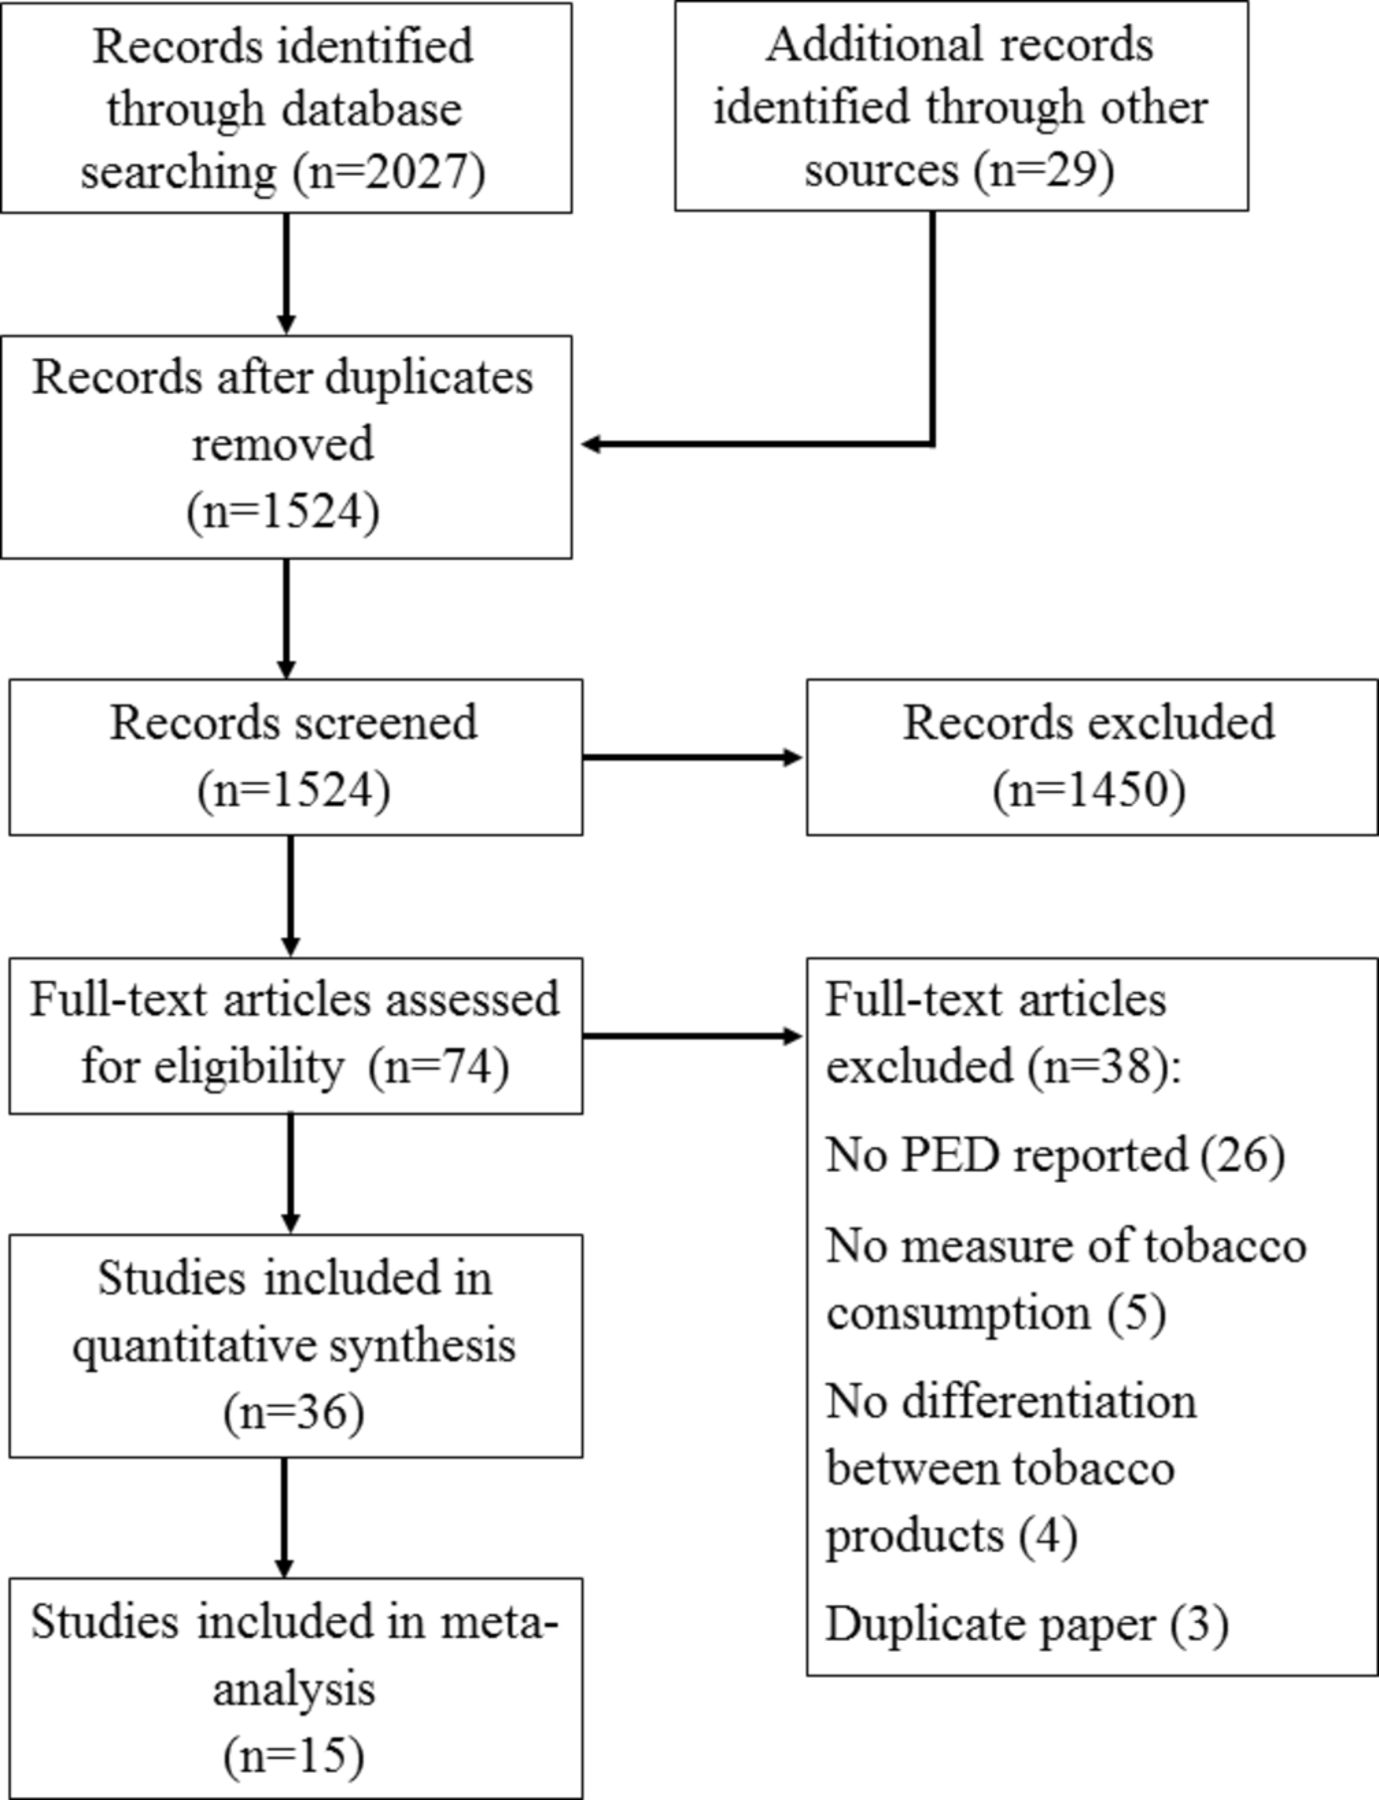
Of 74 potentially eligible studies, we excluded 38 for the following reasons: no price elasticity of demand reported (26), no measure of tobacco consumption (5), no differentiation between tobacco products (4) and duplicate reporting (3) (figure 1). We included 36 studies which reported on 15 countries or regions, most of which were conducted in the USA (41.7%) and India (16.7%) (table 1). The majority of studies were from the high-income countries (63.9%), collected data after the year 2000 (72.2%), used a time series design 47.2% and were conducted among adults (86.1%). The most common model type was ordinary least squares (38.6%) and within models, income was most often adjusted for (in 86.1% of studies), whereas tobacco control policy was least (in 44.4% of studies).
Characteristics of included studies (n=36)
Study flow diagram.
Ten non-cigarette tobacco products were identified. Table 2 lists the number of studies that provided elasticity estimates for each type of non-cigarette tobacco product. Smokeless tobacco was the most commonly studied product; elasticity estimates for smokeless tobacco were identified in almost half of all included studies. We abstracted 125 price elasticity estimates in total; 73 own-price and 52 cross-price elasticities with respect to cigarettes. Detailed information on all estimates and their methodologies are provided in the online supplementary appendix 2.
Number of studies providing elasticity estimates for each type of non-cigarette tobacco product
Meta-analyses
Table 3 presents the results of the meta-analysis of cigars, roll your owns, smokeless tobacco and bidis; all of which had at least three studies measuring quantity of tobacco consumed. For cigars, roll your owns and bidis, price elasticity of demand coefficients were negative and statistically significant, ranging between −0.83 (95% CI −1.38 to −0.29) for cigars and −0.57 (95% CI −0.71 to −0.43) for bidis. Smokeless tobacco also had a negative demand coefficient (−0.21), but this was not statistically significant (95% CI −0.48 to 0.06). Cross-price elasticity estimates were only available for roll your owns and bidis; these showed negative, non-significant demand coefficients (roll your owns, n=3 studies: −0.37, 95% CI −1.36 to 0.62; bidis, n=3 studies: −0.05, 95% CI −0.10 to 0.01).
Meta-analysis of price elasticities and cross-price elasticities of demand (measured quantity consumed) by product and country income level*
Medians
Summaries of median own-price and cross-price elasticities of demand by product, outcome measures and country income level are presented in tables 4 and 5, respectively. Median estimates for bidis, cigars, roll your owns and smokeless tobacco fell within the 95% CI of the meta-analysis results.
Summary of median (minimum, maximum) own-price elasticities of demand by product, outcome measure and income level
Summary of median (minimum, maximum) cross-price elasticities of demand by product, outcome measure and income level
Bidis
Six studies reported price elasticity estimates for bidis, all from India or Bangladesh. Median (minimum, maximum) own-price elasticity was −0.6 (−0.9,–0.1) for quantity consumed,9 16–18 −0.5 (−2.7, 0.0) for participation18–20 and −0.2 for intensity among users.18 Three studies, all measuring quantity of consumption, looked at the cross-price elasticity of demand and reported a median cross-price elasticity of 0.0 (−0.1, 0.0) with respect to cigarettes.9 16 17 21
Cigars
Eight studies reported price elasticity estimates for cigars, all from high-income countries (Finland, Italy, Spain, Taiwan and USA). Median own-price elasticity was −0.9 (−1.7, 0.1) for quantity consumed21–27 and −0.3 for participation.28 Four studies, all measuring quantity of consumption, had a median cross-price elasticity of 0.0 (−1.2, 1.1) with respect to cigarettes.22 23 25
Electronic cigarettes
Five studies reported price elasticity estimates for electronic cigarettes. All were from high-income countries (the USA and six pooled countries in Europe). Four measured quantity consumed and the median own-price elasticity was −1.8 (−2.1,–0.8).21 22 29 30 One study from the USA measured participation and intensity of use, reporting an own-price elasticity of −0.5 (−0.6,–0.4) and −0.1 (−1.0, 0.7), respectively.31 The median cross-price elasticity with respect to cigarettes was 1.2 (0.0, 1.8) for quantity consumed.21 22 29 30
Little cigars
Three studies reported price elasticity estimates for little cigars. All were from the USA, measured quantity consumed and the median own-price elasticity was −1.4 (−3.2, –0.9).21 22 32 The median cross-price elasticity was 0.0 (−0.2, 2.7) with respect to cigarettes.21 22 32
Nicotine patches
One study from the USA, measuring quantity consumed, reported price elasticity estimates for nicotine patches. The own-price elasticity was −2.5 (−3.0,–1.6) and the cross-price elasticity was 0.9 (0.6, 0.9) with respect to cigarettes.33
Pipes
One study reported price elasticity estimates for pipe tobacco. This was from Finland, measured quantity consumed and the own-price elasticity was −0.6. The cross-price elasticity was 2.1 with respect to cigarettes.24
Roll your owns
Six studies reported price elasticity estimates of roll your owns. Five were from high-income countries (Finland, Ireland, the Netherlands and USA), measured quantity consumed and their median own-price elasticity was −0.6 (−1.7, –0.4).21 23 34–36 Their median cross-price elasticity was −0.3 (−1.3, 1.6) with respect to cigarettes.21 23 34–36
For the single study from a low-income and middle-income country (LMIC) (Thailand), the own price elasticity was 0.0 for intensity among users.37
Smokeless
Seventeen studies reported price elasticity estimates for smokeless tobacco, of which 13 were from high-income countries (Italy, Sweden and USA). The median own-price elasticity was −0.2 (−0.5, 0.0) for quantity consumed,21–23 26 38–42 −0.3 (−0.6, 0.0) for participation39 43–46 and −0.1 (−0.2, 0.0) for intensity among users.39 46 The median cross-price elasticity with respect to cigarettes was −0.7 (−0.8, 1.0) for quantity consumed,21–23 26 38–42 0.1 (−0.8, 1.0) for participation43–46 and −0.4 for intensity among users.46
In four studies, all from Bangladesh or India, the median own-price elasticity was −0.5 (−0.6, –0.1) for participation19 20 47 48 and −0.1 for intensity among users.47 The median cross-price elasticity with respect to cigarettes was 0.2 (0.0, 0.4) for participation47 48 and 0.0 for intensity among users.47
Waterpipes
One study reported price elasticity estimates for waterpipe tobacco. This was from Lebanon, measured quantity consumed, and the own-price elasticity was −1.5. The median cross-price elasticity was −0.1 with respect to cigarettes.49
Discussion
We found consistent evidence that price is negatively associated with demand for non-cigarette tobacco products. While effect sizes vary considerably between and within products, all 10 non-cigarette tobacco products identified in this review had negative median price elasticities (ranging between −0.2 for smokeless tobacco to −1.8 for e-cigarettes), indicating that, like cigarettes, price is an effective policy tool in reducing non-cigarette tobacco use. The results of our meta-analysis show that the impact of price increases for non-cigarette tobacco products fall within the established magnitude effect for cigarettes (demand elasticity of −0.4).1 Given absolute values of price elasticity were <1, price inelastic demand for non-cigarette tobacco products was qualitatively similar to cigarette demand. Raising prices on non-cigarette tobacco products is likely to have about the same impact as has been documented for cigarettes.
The few studies that examined the cross-price elasticity of demand with respect to cigarettes suggested a possible spill over effect of taxation policy. We showed that, in high-income countries, cigarettes may act as substitute goods (ie, their demand increases as the price of non-cigarette tobacco products increase) to all non-cigarette tobacco products except for smokeless and roll your own tobacco, which could act as a weak complementary goods (ie, their demand decreases as the price of non-cigarette tobacco products increase). In LMICs, cigarette consumption appears to be weakly affected by increases in the price of bidis or waterpipes.
An analysis of global international surveys found that 36% of tobacco users use non-cigarette tobacco products exclusively,50 so it imperative that better legislative attention is given to non-cigarette tobacco products to avoid premature death. This imperative is more so in LMICs such as southeast Asia where cessation rates are minimal.51 The available evidence suggests tax increases are likely to be an effective tool for reducing consumption of non-cigarette tobacco products, particularly if applied concurrently with cigarette tax increases.
Policy-makers in countries with tobacco-diverse markets, where taxation on non-cigarette tobacco products is generally low, should take heed. In the USA, non-cigarette smoked tobacco consumption increased 117.1% between 2000 and 2015, and in the same time period, smokeless tobacco consumption increased by 23.1%.52 In India, over 260 million people chew smokeless tobacco.51 Of concern are new epidemic settings such as Europe, which is witnessing a growing use in roll your own and waterpipe tobacco53 54 and the Middle East is endemic with waterpipe tobacco use55 and has a growing dokha market.56 When considering price increases for non-cigarette tobacco products, a key goal should be an increase in the prices (adjusted for income and inflation) for all kinds of tobacco products. Furthermore, the potential for a substitution effect (towards cigarettes or other tobacco products) and other price-minimising behaviours must be considered. To prevent these phenomena, it is essential that price increases do not occur in isolation, but instead occur simultaneously across all tobacco products, including cigarettes.
Price increases for non-cigarette tobacco products should exceed increases in income because several studies have shown that increasing income results in increased non-cigarette tobacco use.19 26 39 However, a greater number of studies, all from high-income countries, have shown the inverse that increases in income may reduce demand for non-cigarette tobacco products.34–36 42–45 Further research is required to drive forward these policies, particularly as non-cigarette tobacco products are often overlooked in the tobacco research and policy discourse.57 58
Pricing and tax policies require carefully planning to ensure that feasibility of implementation because non-cigarette tobacco industries may be structured differently to cigarette industries. In India, for example, as bidi production is fragmented and mainly carried out by female home-based workers under contractors,9 it makes tax collection challenging. For the waterpipe tobacco industry, its users often share the pipe in groups; any increase in taxation is likely to translate into a lower price increase per user. The main limitations of this review relate to the quality of included studies. For example, we were unable to conduct a complete meta-analyses across all studies due to the fact that most demand coefficients failed to include a measure of precision for the construction of 95% CIs. We tried to mitigate this by contacting all authors and asking for additional analyses to be undertaken in order to provide measures of precision. However, medians were generally concordant with effect estimates from our meta-analysis, adding an element of triangulation and validity to our analytic approach. We were unable to compare price elasticity estimates for non–cigarette tobacco products in high-income countries and LMICs except for smokeless tobacco where price elasticity demand coefficients were similar (coefficient −0.2).
Seven studies in our review used tax increases as a proxy measure for price,20 40 43–46 59 which may introduce a measurement error when opportunities for tax evasion and avoidance exist, and hence upwardly biassing our estimates. Further measurement errors can occur if timing is not incorporated into the statistical approach, as users and retailers may stock up on tobacco products in anticipation of a tax increase. However, using tax as proxy measure for price is supported due to endogeneity in the demand model which can itself cause endogeneity bias in price elasticity estimation.1
Over half of our studies relied on cross-sectional survey data at a single point in time rather than time series data. Results from some studies might be subject to bias as price variable is endogenous. Endogeneity can be partly addressed by using average measures of price or by using instrumental variables via two-stage least-squares methods. In addition, a common limitation of using survey data to estimate tobacco demand is the fact that tobacco use may be under-reported; however, if under-reporting is systematic this is unlikely to affect elasticity estimates, which reflect relative changes.
Another limitation includes our lack of subgroup analyses beyond country income level. There are important and distinct impacts of pricing on different population segments. Age, gender and sociodemographic stratifications should be considered in future work to address the impact of taxation on inequalities. Finally, nearly two-thirds of our elasticity estimates were based on the quantity of tobacco consumed; these are unlikely to have captured cross-border sales, illicit production, smuggling and tax evasion. This is important as reductions in quantity consumed, rather than cessation, could still bear a substantial risk of mortality.60 With regards to illicit activity, such trade occurs in both low-taxed and high-taxed jurisdictions, without a correlation between rates of tobacco taxation and tobacco smuggling,61 so policy-makers should not see this is as a possible drawback to increasing tobacco taxation.
To conclude, the available evidence suggest price increases are likely to be an effective tool for reducing consumption of non-cigarette tobacco products. Countries that have tobacco-diverse markets should raise taxes on non-cigarette tobacco products to prevent premature death.
What this paper adds
Taxation is an effective policy to reduce both tobacco initiation and to promote cessation.
The prevalence of non-cigarette tobacco products is increasing in many countries.
The effect of increased price on the consumption of non-cigarette tobacco products is uncertain.
Price increases are likely to be an effective tool for reducing consumption of non-cigarette tobacco products.
Acknowledgments
The authors thank Dr Carlo Ciccarelli, Dr Laura Cornelsen, Dr Chad Cotti, Dr Rijo John, Dr Jenny Mindell, Dr Lien Nguyen, Dr Nigar Nargis, Dr Nisreen Salti and Dr Justin White for providing additional study information.
References
Footnotes
Contributors All authors: conceptualised the study and edited the first draft and approved the final draft. MJ and JTL: conducted search and abstracted data. MJ, JTL and SG: statistical analysis. MJ: wrote first draft.
Funding This review received no specific funding. CM is funded through an NIHR Research Professorship award. SG work was supported in part by National Institute of Drug Abuse grant R01 DA043950. The Public Health Policy Evaluation Unit at Imperial College London is supported by funding from the NIHR School of Public Health Research.
Disclaimer The funding agency played no role in the selection of the specific research question, conduct of the research or preparation of the manuscript.
Competing interests None declared.
Provenance and peer review Not commissioned; externally peer reviewed.
Data sharing statement All data used in this paper can be found in the Online Appendix.
Correction notice This article has been corrected since it published Online First. In the Funding statement ’National Cancer Institute Grant CA-087472' has been corrected to ’National Institute of Drug Abuse grant R01 DA043950'.