Article Text

Abstract
Objectives Tobacco flavours are an important regulatory concept in several jurisdictions, for example in the USA, Canada and Europe. The European Tobacco Products Directive 2014/40/EU prohibits cigarettes and roll-your-own tobacco having a characterising flavour. This directive defines characterising flavour as ‘a clearly noticeable smell or taste other than one of tobacco […]’. To distinguish between products with and without a characterising flavour, we trained an expert panel to identify characterising flavours by smelling.
Methods An expert panel (n=18) evaluated the smell of 20 tobacco products using self-defined odour attributes, following Quantitative Descriptive Analysis. The panel was trained during 14 attribute training, consensus training and performance monitoring sessions. Products were assessed during six test sessions. Principal component analysis, hierarchical clustering (four and six clusters) and Hotelling’s T-tests (95% and 99% CIs) were used to determine differences and similarities between tobacco products based on odour attributes.
Results The final attribute list contained 13 odour descriptors. Panel performance was sufficient after 14 training sessions. Products marketed as unflavoured that formed a cluster were considered reference products. A four-cluster method distinguished cherry-flavoured, vanilla-flavoured and menthol-flavoured products from reference products. Six clusters subdivided reference products into tobacco leaves, roll-your-own and commercial products.
Conclusions An expert panel was successfully trained to assess characterising odours in cigarettes and roll-your-own tobacco. This method could be applied to other product types such as e-cigarettes. Regulatory decisions on the choice of reference products and significance level are needed which directly influences the products being assessed as having a characterising odour.
- advertising and promotion
- public policy
- prevention
This is an open access article distributed in accordance with the Creative Commons Attribution Non Commercial (CC BY-NC 4.0) license, which permits others to distribute, remix, adapt, build upon this work non-commercially, and license their derivative works on different terms, provided the original work is properly cited and the use is non-commercial. See: http://creativecommons.org/licenses/by-nc/4.0/
Statistics from Altmetric.com
Introduction
Tobacco use is one of the biggest public health threats the world has ever faced, causing a mortality of 7 million each year.1 In order to protect the health of European citizens, regulatory measures have been implemented to reduce smoking prevalence.2
A step towards protecting in particular youth and adolescents is to implement measures on flavour regulation. Flavours such as menthol and vanilla increase the attractiveness of tobacco products by masking the harshness of tobacco smoke, and thereby facilitate initiation of tobacco consumption.3 4 Concerns have been raised that flavoured tobacco products are targeted at young people5–8 because youth and adolescents are particularly attracted to the use of flavoured tobacco products.9 10 Whereas the US Food and Drug Administration (FDA) Tobacco Control Act11 and a Canadian amendment to the Tobacco Act12 have prohibited characterising flavours other than tobacco or menthol in cigarettes, the European Tobacco Products Directive (TPD) 2014/40/EU prohibits cigarettes and roll-your-own tobacco with a characterising flavour other than the one of tobacco.2
Art. 2 (25) of the TPD defines a characterising flavour as ‘a clearly noticeable smell or taste other than one of tobacco, resulting from an additive or a combination of additives, including, but not limited to, fruit, spice, herbs, alcohol, candy, menthol or vanilla, which is noticeable before or during the consumption of the tobacco product’.2 In this definition, tobacco means ‘leaves and other natural processed or unprocessed parts of tobacco plants, including expanded and reconstituted tobacco’.
To practically distinguish between products with and without a characterising flavour, a sensory method is required. Talhout and colleagues provided an overview of methods that could be used to assess characterising flavours in tobacco products.13 14 Sensory expert panels are commonly used by the tobacco industry to assess sensory product characteristics.15 16 Alternatively, consumer panels could be used to test consumers’ perceptions and responses to product characteristics.17 Human sensory testing is often combined with chemical-analytical methods.16 For example, gas chromatography-mass spectrometry (GC-MS) could be used to identify18 19 and quantify20 flavour additives in tobacco products.
Recently, as part of the Health Effects Tobacco Composition (HETOC) consortium supporting the European Commission, we developed a method for identification of characterising flavours in tobacco products.13 We proposed to assess characterising flavours by using a combination of an expert panel that assesses flavours by smelling tobacco samples, and headspace GC-MS.13 The final HETOC report includes our considerations regarding other potentially applicable methods.13 The headspace GC-MS method to identify flavour additives in tobacco products has been further developed, and the results provide a starting point for an extensive database of flavour components.18
Here, we describe the results of our sensory method to assess odours of unburnt tobacco products using a sensory expert panel. Quantitative Descriptive Analysis (QDA)21 was used to determine which of the products tested had a characterising odour compared with reference products. The QDA method is commonly used in the food industry to evaluate sensory characteristics of products such as dairy products,22 23 grapes and wines,24 25 and fruits and vegetables.26–28
Our paper describes odour evaluation for European regulatory purposes; a similar method could be used by other regulatory institutes such as the US FDA to support their rule on characterising flavours in tobacco products.11
Materials and methods
A trained panel evaluated 20 tobacco products (table 1). Because of commercial sensitivity, brand names have been anonymised similar to our previous work.13 18 Twelve products from common brands expected not to have a flavour other than tobacco were included (from now referred to as ‘reference products’); eight products expected to impart a common characterising flavour such as menthol, vanilla or cherry were included (from now referred to as ‘test products’). Product selection was based on package advertisements, ingredient lists from tobacco manufacturers,29 preliminary smelling experiments and marketing information. Commercially available products were purchased in (online) tobacco stores (the Netherlands). Filter cigarettes without additives and tobacco leaves were respectively bought at Borgwaldt (Hamburg, Germany) and Leaf Only (Middletown, Connecticut).
Tobacco products (n=20) assessed by the sensory panel
Our method consisted of three phases: panel selection, panel training and product testing using the QDA method. Screening, training and test sessions were hosted by a panel leader and assistant, and took place at Wageningen University (the Netherlands).
Phase 1: panel selection
A trained QDA panel generally consists of 12 members to provide the optimal balance between sufficient statistical power and achieving panel agreement.30 Considering possible dropouts, we aimed to select 18 healthy male/female participants from the 164 respondents, aged 18–55 years and being native Dutch speakers (because of attribute generation). Both smokers and non-smokers were included. Exclusion criteria were self-reported use of medications known to affect smell perception, pregnancy (plans), lactation and uncorrected smelling, hearing or sight problems.
An interview was conducted to screen for general prerequisites (eg, availability and motivation). An odour recognition test and intensity test were performed in which participants respectively identified 10 odours using the check-all-that-apply (CATA) method and scored odour intensity on a 100 mm Visual Analogue Scale (VAS) from ‘weak’ to ‘strong’. This test was repeated to quantify panellists’ repeatability. Finally, Sniffin’ Sticks were used to test olfactory function according to threshold, discrimination and identification measures (TDI score).31 Participants were selected if they met the normative standards of the Sniffin’ Sticks test (TDI score >30.5)32 and were among the 18 best performing participants of the other olfactory tests.
Phase 2: panel training
Panel training aims to improve odour identification ability, and to rate odour intensity in an accurate, consistent and repeatable manner. The training phase consisted of 14 training sessions: two sessions of 1.5 hours per week for seven consecutive weeks. Three types of training sessions were distinguished: attribute training, consensus training and performance monitoring.
Attribute training (weeks 1 and 2)
Attribute training sessions aim to generate odour attributes (ie, odour descriptors), with which the panel distinguishes the products included in this study. A panel-specific list of odour attributes was created through group discussions on each of the products’ odour. After the attribute training sessions, the attribute list was further optimised during consensus training sessions.
Performance monitoring (weeks 3, 5 and 7)
Performance sessions aim to monitor panel quality in terms of consensus, discriminatory ability and repeatability. The attribute list generated during the previous attribute or consensus training session was used to assess the 20 products from table 1 in duplicate in a simulated test situation (see the Phase 3: product testing section). Panellists individually assessed 10 (weeks 3 and 5) or 20 (week 7) products in duplicate.
Consensus training (weeks 4 and 6)
Consensus training sessions aim to optimise panel consensus (ie, agreement) on the attribute list via group discussions. The panel focused on attributes and products that were discriminated and assessed without consensus or in a non-repeatable manner during the previous performance-monitoring session. If needed, odour attributes were further clarified using example odours of real (food) products. Attributes were revised or eliminated until panellists reached consensus on the final attribute list.
Phase 3: product testing
Test sessions were performed by the 12 best performing panellists.33 Individual panellist performance was determined during a performance session prior to the test session. Other panellists remained part of the panel to account for dropouts, holidays or illness.
Sample preparation
Test samples were prepared from an unopened package the day before each test session. The content of one cigarette (after removal of filter and paper) or 0.7 g of RYO tobacco or tobacco leaves was put in semitransparent brown 50 mL amber glass bottles. The glass bottle was covered with tinfoil to eliminate visual cues, and labelled with a random three-digit code. Products were stored in their original package, covered in tinfoil, in closed boxes in a refrigerator. Test samples were removed from the refrigerator 4 hours before the start of the test session.
Test procedure
Products were tested in a room with appropriate air ventilation and temperature control, containing individual sensory booths with a computer screen.
Twenty products (table 1) were evaluated in triplicate in a randomised order during six smelling sessions using the QDA method.21 Duration of the test sessions was 1.5 hours. Panellists took a 30 s break between samples to neutralise their sense of smell. A 5 min break was scheduled after evaluation of six samples. Panellists were allowed to re-smell the sample as often as preferred. Once the sample was evaluated on each attribute, the next sample was provided.
For each product, intensity of each odour attribute was rated using the computer program EyeQuestion (Logic8, V.3.7.6). Panellists indicated odour intensity on a 100 mm VAS with opposite terms (weak and strong) at 10 and 90 mm of the line scale. An extra option allowed scoring for additional odours that were not included in the attribute list. This is particularly relevant when new products that were not evaluated during the training sessions would be tested.
Data analysis
The statistical software program R with SensoMineR and FactoMineR packages was used for data analysis.34 During the training phase, panel and panellist performance were determined for each attribute using an analysis of variance, including the three-way interaction between product, panellist and session. Results were considered significant if p<0.05.
For product testing, the average odour profile of the triplicate measurement was used for statistical analysis. First, a multivariate analysis of variance (MANOVA) was used to differentiate products based on the odour attributes.34 A visual product space was obtained using Principal Component Analysis (PCA). Data were centred and scaled for each variable (ie, odour attribute) using respectively their estimated mean and variance.
Second, Hierarchical Clustering on Principal Components was used to define clusters based on product similarities.34 The number of clusters needs to be methodologically chosen in a way that the reference products belong to the same cluster, as this cluster will represent the reference cluster. We divided the products into four and six clusters, respectively. A MANOVA and PCA were performed to visualise differences between the reference cluster and test products. Confidence ellipses of the mean odour profile were generated using CIs of 95% and 99%, respectively. In order to determine which products impart a characterising flavour, Hotelling’s T-tests for both 95% and 99% CIs were used to assess significant differences between reference and test products. Products that significantly differed from the reference cluster for the overall Hotelling’s T-test and for at least one single sensory odour attribute were considered to have a ‘clearly noticeable’ characterising odour other than tobacco.
Results
Panel characteristics and final attribute list
From 164 respondents, 18 panellists were included, with an average age of 24±9 years. The panel included both females (n=15) and males. The panel included non-smokers (n=15), smokers of <1 cigarette/day (n=2) and one smoker of 6–10 cigarettes/day. The final attribute list as generated by the panel after 14 training sessions consisted of 13 odour descriptors: smoky/burned, vanilla/caramel, coconut, chocolate/cocoa, nutty, raisin, honey, liquorice, hay, red fruit, menthol/mint, tea and clove.
Panel performance
Panel performance after weeks 3 and 5 of the training phase was monitored to record progress (data not shown). After week 7, panel performance showed that each of the attributes was used by the panel to significantly discriminate between the products (product effect, p<0.05). In addition, panellists scored intensity of the attributes in a significantly different way (panellist effect, p<0.05). No significant differences were found across sessions, meaning that attributes were assessed in a consistent and repeatable manner (session effect, p>0.05), except for hay (p=0.029) and raisin (p=0.008). The product’s odour profile, ie, pattern of attribute intensity, significantly differed across panellists in terms of absolute intensity values (product-panellist interaction, p<0.05), except for nutty (p=0.337). This measure is less important since QDA data must be viewed as relative rather than absolute values (within panellist differences).33 Regarding panel repeatability, attribute intensity for each of the products was evaluated in a similar way across sessions (product-session interaction, p>0.05), except for vanilla (p<0.001). Furthermore, individual panellists evaluated the attributes in a similar way compared with the panel average across sessions (panellist-session interaction, p>0.05), except for clove (p=0.024), coconut (p=0.028) and tea (p=0.050).
Test results
Attribute intensity
Table 2 shows average attribute intensity scores with SD (on a 100 mm VAS) for each product. Odour attributes with an intensity higher than 50 (highlighted in bold) were considered odours that are typical for a particular product. Regarding the reference products, RYO-RP1 and RYO-RP2 had a typical smoky/burned odour; Cig-RP1 and Cig-RP4 were described to have a chocolate/cocoa odour with an intensity score of 51.4 and 51.1, respectively; Cig-RP3 and Burley and Oriental leaves were described by hay; and CM6 had a typical tea odour. Regarding the test products, Cig-TP1 and Cig-TP2 were described by menthol/mint; Cig-TP5 by red fruit and clove; RYO-TP1 had a typical vanilla/caramel odour; and Cig-TP4 was described by vanilla/caramel and coconut.
Mean attribute intensity (±SD) for each product as indicated by the panel on a line scale from 0 to 100 mm
Principal component analysis
Data variance was mostly explained by up to five principal components (PCs; total sum 89.9%, data not shown). Figure 1 shows the product space and factor map of PC1 and PC2 (28.3% and 19.3% explained variance, respectively). Main determinants of PC1 were smoky/burned which is associated with RYO-RP1 and RYO-RP2, and red fruit and clove, representing Cig-TP5. PC2 was driven by coconut and vanilla which are most specific for Cig-TP4 and RYO-TP1. Regarding PC3 (17.2% explained variance), one side was determined by red fruit and clove, whereas the other side represented menthol and liquorice odour attributes (data not shown).
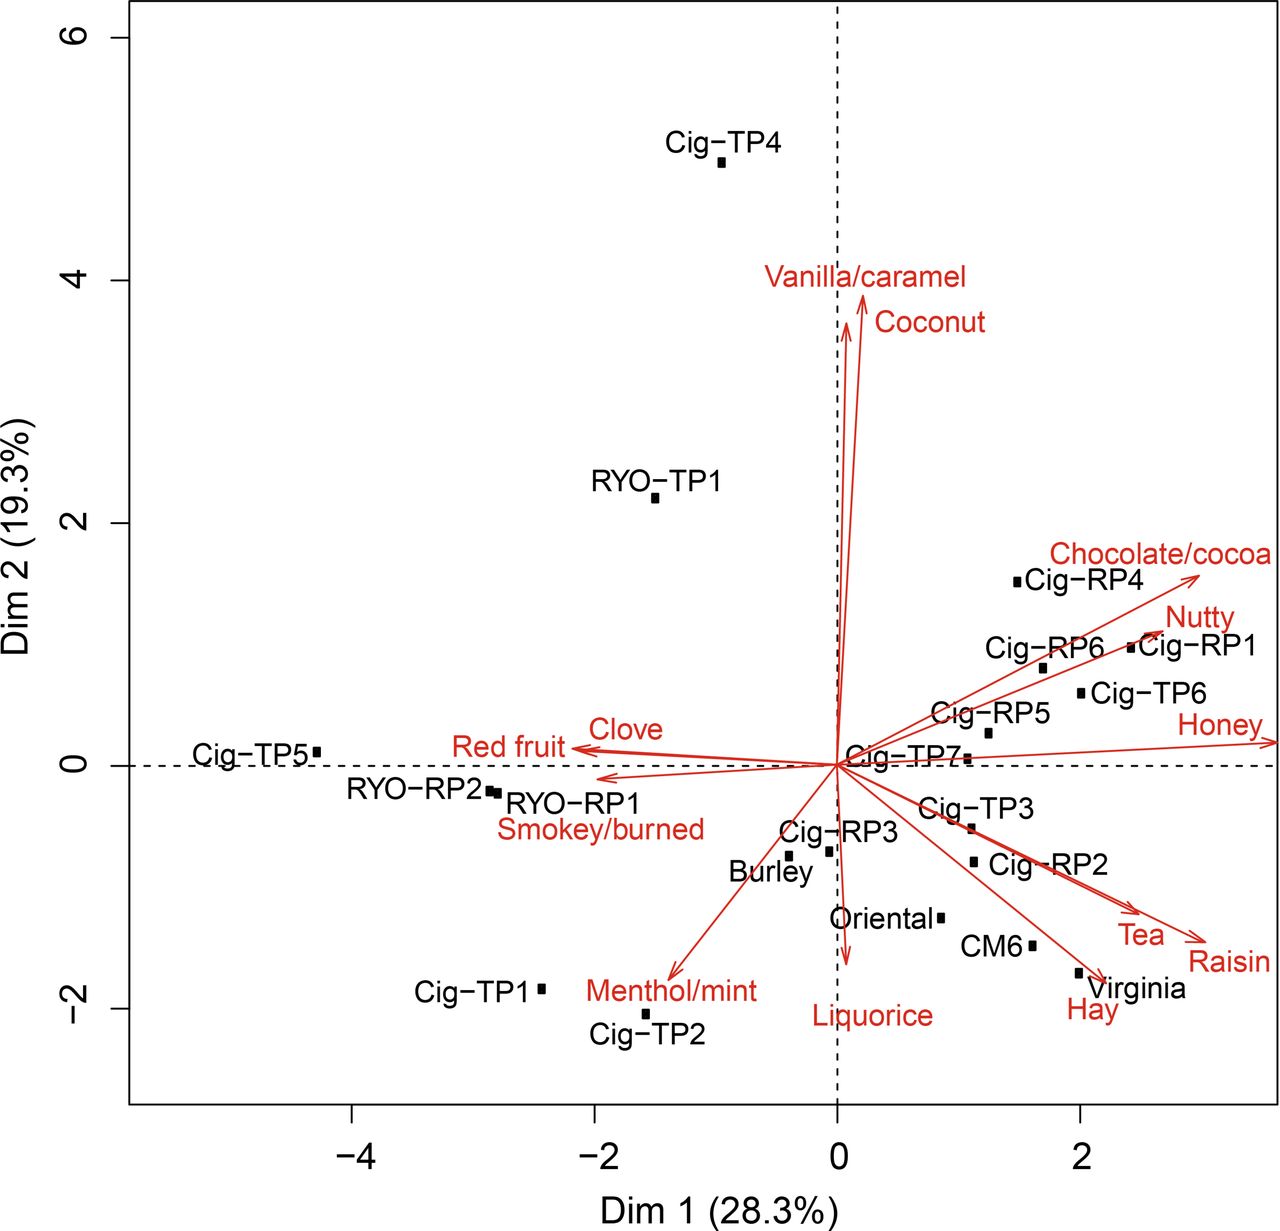
Principal component analysis biplot of the PC1 and PC2 product space and, marked in red, the attribute factor map. Reference products Cig-RP1, Cig-RP2, Cig-RP3, Cig-RP4, Cig-RP5, Cig-RP6, RYO-RP1, RYO-RP2, CM6, Virginia, Burley and Oriental were expected to have a tobacco flavour. Test products Cig-TP1 and Cig-TP2 were expected to have a menthol flavour, Cig-TP4 and RYO-TP1 were marketed as vanilla, Cig-TP5 as cherry, and Cig-TP3, Cig-TP6 and Cig-TP7 were expected to potentially have a flavour other than tobacco. RP, reference product; RYO, roll-your-own; TP, test product.
Hierarchical clustering
Hierarchical cluster analysis was based on the entire product space. Figure 2 shows the results of the hierarchical cluster analysis of four and six clusters (figure 2A and B, respectively). Each colour represents a cluster that is significantly discriminated from the other clusters with p<0.05 by one or more odour attributes.
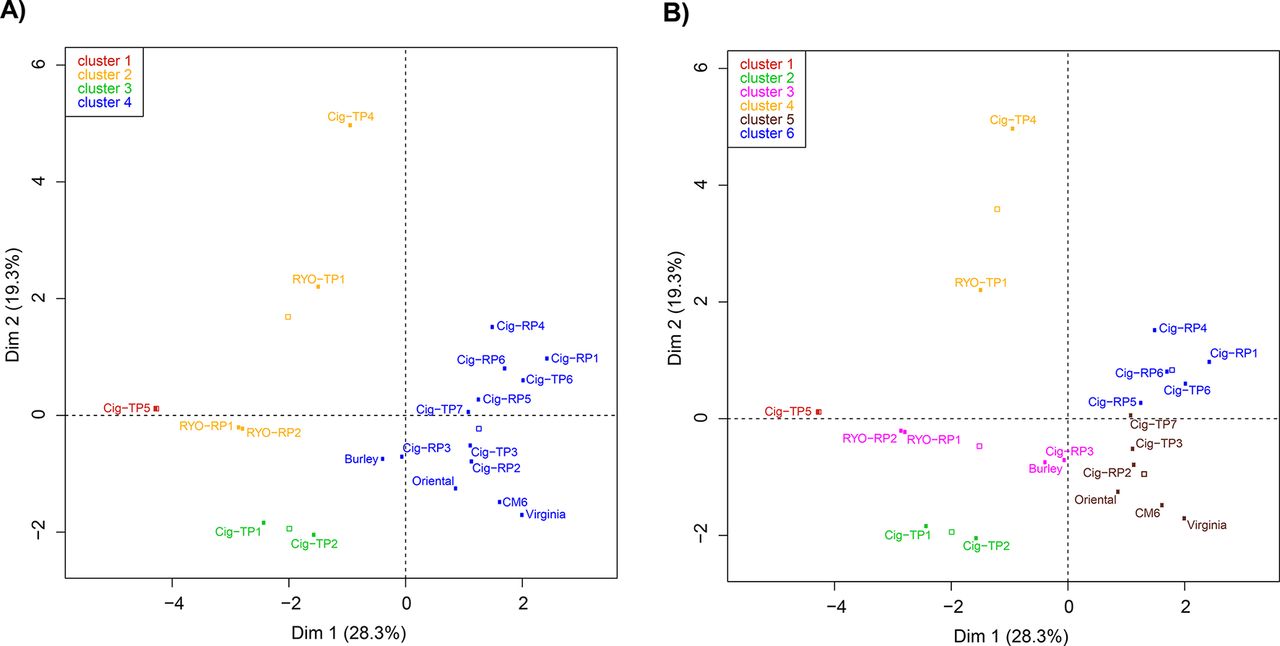
Results of hierarchical cluster analysis of the 20 tobacco products tested with four (A) and six (B) clusters. Each colour represents a cluster that is significantly discriminated from other clusters (p<0.05) by one or more odour attributes (odour attributes not shown in this figure). Open squares represent the clusters’ average. Cig-RP1, Cig-RP2, Cig-RP3, Cig-RP4, Cig-RP5, Cig-RP6, RYO-RP1, RYO-RP2, CM6, Virginia, Burley and Oriental are products expected to have a tobacco flavour. Cig-TP1 and Cig-TP2 were expected to have a menthol flavour, Cig-TP4 and RYO-TP1 were marketed as vanilla, Cig-TP5 as cherry and Cig-TP3, Cig-TP6 and Cig-TP7 were expected to potentially have a flavour other than tobacco. RP, reference product; RYO, roll-your-own; TP, test product.
In figure 2A, four clusters were distinguished. Cluster 1 (red colour) only contained the cherry-flavoured Cig-TP5 and was significantly described by the clove and red fruit attributes (p<0.001 for both). Cluster 2 (yellow) contained RYO-RP1, RYO-RP2, RYO-TP1 and Cig-TP4, and was significantly determined by smoky/burned (p=0.002), vanilla/caramel (p=0.025), hay (p=0.05), honey (p=0.03) and raisin (p=0.03). Cluster 3 (green) contained the menthol-flavoured Cig-TP1 and Cig-TP2, and was significantly determined by menthol/mint and liquorice (p<0.001 for both). Finally, cluster 4 (blue) contained the expected non-flavoured products and was therefore considered the reference cluster. This cluster was significantly determined by hay (p<0.001), honey (p<0.001), raisin (p=0.003), chocolate/cocoa (p=0.006), nutty (p=0.01) and tea (p=0.01).
In figure 2B, six clusters were distinguished. Cluster 1 (red) again contained the cherry-flavoured Cig-TP5, and was significantly determined by clove and red fruit (p<0.001 for both). Cluster 2 (green) contained the menthol-flavoured Cig-TP1 and Cig-TP2, and was significantly determined by menthol/mint and liquorice (p<0.001 for both). Cluster 3 (pink) contained RYO-RP1, RYO-RP2, Cig-RP3 and Burley leaves. This cluster was significantly described by smoky/burned (p<0.001) and honey (p=0.007). Cluster 4 (yellow) represented the vanilla-flavoured Cig-TP4 and RYO-TP1, and was significantly determined by vanilla/caramel and coconut (p<0.001 for both). Cluster 5 (brown) consisted of Cig-TP7, Cig-TP3, Cig-RP2, CM6, and Oriental and Virginia leaves. This cluster was significantly determined by raisin (p=0.002), tea (p=0.004) and hay (p=0.03). Finally, cluster 6 (blue) included the commercially available cigarettes Cig-RP1, Cig-RP4, Cig-RP5, Cig-RP6 and Cig-TP6, and was significantly determined by chocolate/cocoa (p<0.001), nutty (p=0.001) and honey (p=0.013). In this case, both clusters 5 and 6 could be argued to represent the reference cluster.
Confidence ellipses
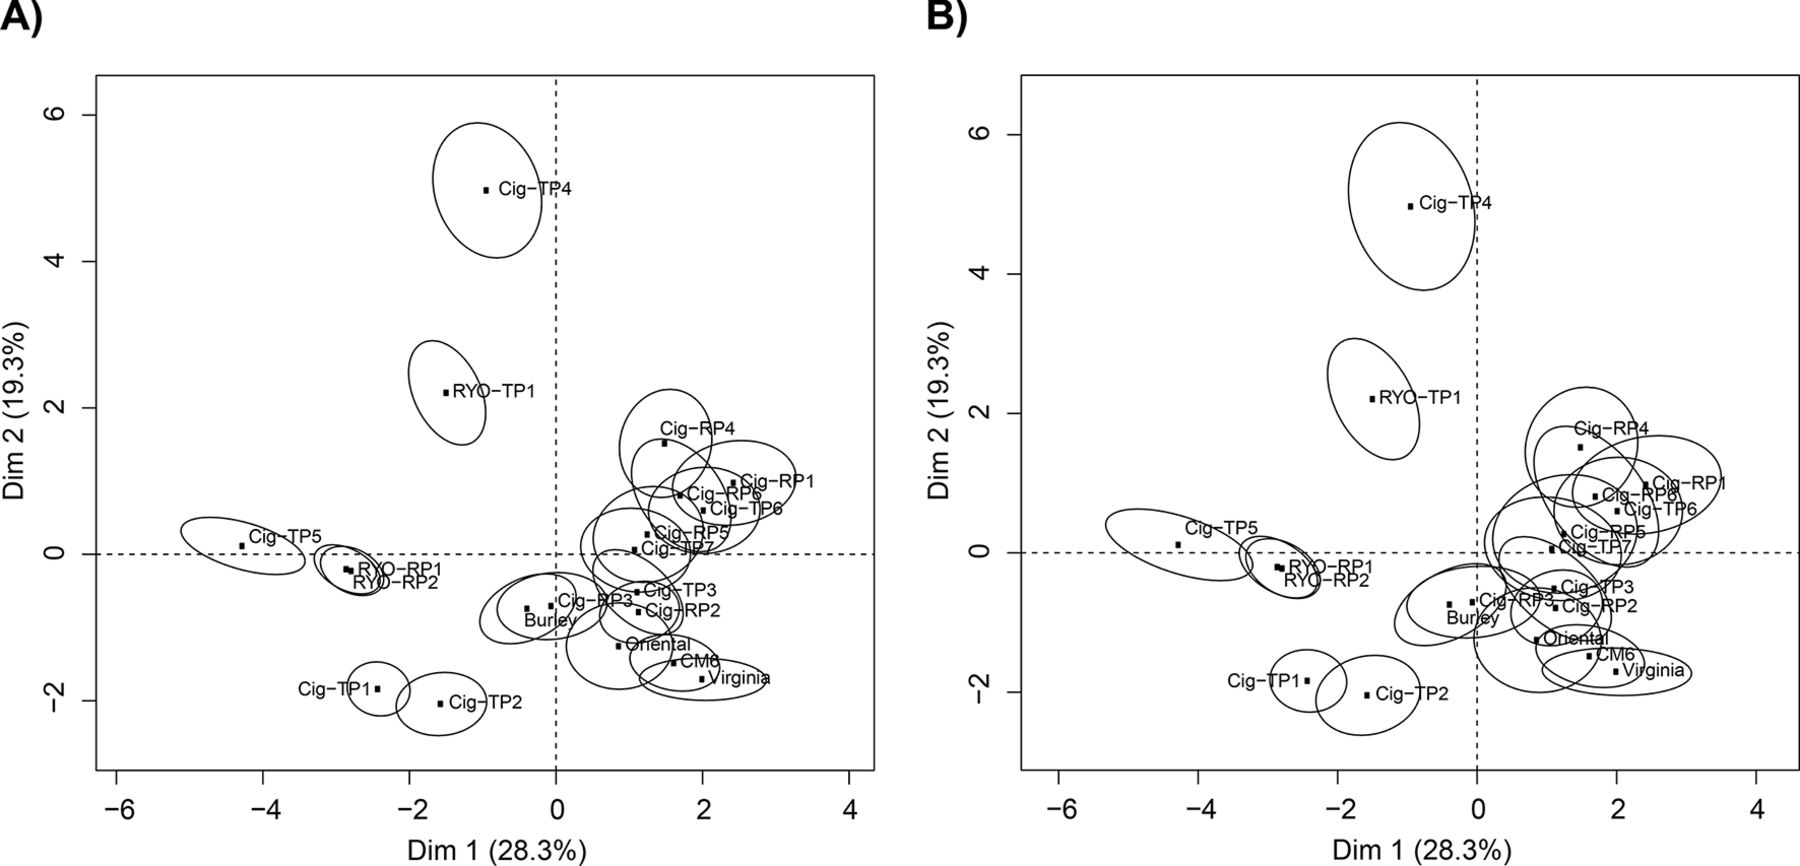
Figure 2 allows to determine a reference cluster with products having a ‘tobacco smell’ and thus no characterising flavour. Hotelling’s T-tests were used to find products that significantly differ from the established reference cluster. Figure 3 shows PC1 and PC2 product maps with confidence ellipses based on a 95% CI (figure 3A) and 99% (figure 3B) CI. Non-overlapping confidence ellipses represent products that significantly differ according to the panel’s assessment. The following products were significantly different from the reference cluster (cluster 4) in figure 3A (p<0.05) as well as both possible reference clusters (clusters 5 and 6) in figure 3B (p<0.01): Cig-TP5 (cherry-flavoured), Cig-TP4 and RYO-TP1 (vanilla-flavoured), Cig-TP1 and Cig-TP2 (menthol-flavoured) and RYO-RP1 and RYO-RP2 (roll-your-own products). Thus, these cigarettes and RYO products can be considered to have a characterising odour other than the one of tobacco-flavoured reference products.

Confidence ellipses with a 95% CI (figure 3A, α=0.05) and a 99% CI (figure 3B, α=0.01) of the 20 tobacco products tested. Reference products Cig-RP1, Cig-RP2, Cig-RP3, Cig-RP4, Cig-RP5, Cig-RP6, RYO-RP1, RYO-RP2, CM6, Virginia, Burley and Oriental were expected to have a tobacco flavour. Test products Cig-TP1 and Cig-TP2 were expected to have a menthol flavour, Cig-TP4 and RYO-TP1 were marketed as vanilla, Cig-TP5 as cherry, and Cig-TP3, Cig-TP6 and Cig-TP7 were expected to potentially have a flavour other than tobacco. RP, reference product; RYO, roll-your-own; TP, test product.
Discussion
The TPD has banned flavoured cigarettes and RYO products, and defines a characterising flavour as ‘a clearly noticeable smell or taste other than one of tobacco, resulting from an additive or a combination of additives, including, but not limited to, fruit, spice, herbs, alcohol, candy, menthol or vanilla, which is noticeable before or during the consumption of the tobacco product’.2 This definition provides a challenge for European regulators to clearly distinguish tobacco flavour from a ‘characterising flavour’.35 We used tobacco leaves and commercial products marketed as unflavoured as reference products, and thus examples of ‘tobacco flavour’.
Our method included an expert panel that smelled tobacco and evaluated its odour using QDA. QDA and CATA both are suitable for odour assessment.14 QDA was considered more applicable as it provides information on intensity and thus is relevant to determine ‘clearly noticeable’, whereas CATA focuses on odour presence only. Furthermore, we evaluated products through tobacco smelling which was considered more appropriate than smoking for practical and ethical reasons. Smoking more closely represents consumer behaviour, hence could be considered as well. Finally, a consumer panel could also be used to assess odours, as consumers and expert panels show similar results for discriminatory ability and reproducibility.36 However, as consensus on attribute intensity is higher in expert panels due to panel training36 and conclusions will provide support for European legislative purposes, the use of expert panellists was considered more appropriate than consumers. Expert panels are also commonly used in the food industry, for example, to determine the quality of butter37 and virgin olive oils.38
Overall, our sensory expert panel was able to generate odour attributes, in consensus, for a wide range of tobacco products marketed as flavoured and unflavoured. Therefore, these odours are noticeable smells. Creating a product and reference space, depending on the number of clusters, determines ‘tobacco smell’ and its boundaries. Hotelling’s T-tests determined whether a product’s odour was perceived as ‘other than the one of tobacco’ based on a particular attribute. If a test product’s odour intensity was significantly higher than the ‘noticeable smell’ of reference products, according to the Hotelling’s T CI, this product could be concluded to have a ‘clearly noticeable smell’. In this way, the panel distinguished RYO products and products marketed to have a flavour such as cherry, menthol and vanilla from a reference cluster of commercial tobacco-flavoured brands and tobacco leaves (four-cluster analysis).
The number of clusters chosen determines the size and composition of the reference cluster. For example, the six-cluster analysis significantly separated natural tobacco leaves (cluster 5) from unflavoured commercial cigarettes (cluster 6) and RYO products (cluster 3). In this case, a decision should be made whether the tobacco leaves or cigarettes marketed as unflavoured act as reference cluster. Choosing one cluster as reference cluster would result in the other cluster being significantly different and thus having a characterising odour within our framework. This explains why it is important to carefully define reference products beforehand and to choose the number of clusters in a way that these reference products belong to the same cluster. Similarly, regulators should carefully decide the CI (95% or 99%), as this will critically influence the number of products that statistically differ from the reference cluster and thus have a characterising odour.
Strikingly, odour intensity for chocolate/cocoa was higher than 50 (on 100 mm VAS) for two reference products, and close to 50 for another. In addition, cluster 6, including five of the commercial tobacco-flavoured cigarettes, was statistically described by chocolate/cocoa odour. It is known that manufacturers commonly add cocoa extract to their products29 to increase tastiness and decrease tobacco harshness which appeals to particularly women and youth.39 This raises an interesting regulatory question whether products containing chocolate/cocoa casings at this intensity level should be considered products with a ‘clearly noticeable flavour other than tobacco’. Therefore, it would be interesting to measure chocolate/cocoa odour intensity in a larger number of commercial tobacco-flavoured cigarettes in order to determine which products would have a characterising chocolate odour according to our method.
Recommendations for further research
Panel performance in terms of discriminatory ability and repeatability was considered sufficient after 14 training sessions, despite some exceptions for particular attributes. Therefore, and to distinguish between products with more subtle odours such as caramel and vanilla, we recommend a more extensive training period of, for example, 6 months. Furthermore, statistical results showed that RYO products could be distinguished from cigarettes, hence we recommend to determine a separate product space for RYO products. In addition, if more products and/or more odour attributes were to be tested, statistical correction for multiple testing would be recommended. In our four-cluster analysis, the three potentially flavoured products (Cig-TP3, Cig-TP6 and Cig-TP7) belonged to the reference cluster. They might have been distinguished from reference products if the panel was able to distinguish more subtle odours, or they indeed do not contain a flavour other than tobacco. Furthermore, if a panel needs to be maintained for a longer period, maintenance meetings (eg, once a month) should be organised in which panel performance is monitored and, if needed, improved.
Additional experiments with a consumer panel and/or smoking could be considered in order to more closely represent real-life tobacco use and to determine whether products exist that have a characterising flavour without having a characterising odour (eg, taste, trigeminal sensations). Sensory analysis could be combined with chemical-analytical measurements in order to quantify the threshold value for characterising odours.40 Odour threshold quantification might help regulators to set upper limits for odour compounds. One of our previous publications describes a chemical-analytical method to identify flavourants in tobacco products, and to determine whether the flavour is derived from a (combination of) compound(s) that is not present in natural tobacco leaves, and therefore may be considered an additive.18 Finally, we assessed odours of isolated tobacco. Because manufacturers may also encase flavour additives in filter capsules or wrapping paper, additional steps including odour testing of the complete product could be taken.
We assessed odours of cigarettes, roll-your-own products and tobacco leaves. Because we eliminated visual cues, our method is also suitable to assess odours in other product types such as the electronic cigarette (e-cigarette) and waterpipe. For example, sensory research on e-cigarettes would be interesting, as the number of unique e-liquid flavours already exceeded 7500 by January 2014.41 If our method is applied to other products or product types, a renewed attribute list is required as this list is specific to the products tested.
Conclusion
We trained an expert panel to identify characterising flavours in tobacco products by smelling. Our panel was able to distinguish products marketed to have a characterising flavour such as cherry, menthol and vanilla from a reference cluster of commercial tobacco-flavoured cigarettes and tobacco leaves. Therefore, we consider smelling a good starting point to assess characterising flavours in tobacco products. We described odour evaluation for European regulatory purposes; a similar method could be used by other regulatory institutes such as the US FDA and Health Canada to support their rules on characterising flavours in tobacco products. Regulatory decisions should be made regarding the statistical cut-off value that distinguishes ‘noticeable’ from ‘clearly noticeable’ and ‘characterising’ from ‘non-characterising’. Furthermore, regulators should decide which products are non-characterising (eg, tobacco leaves or commercial products marketed as unflavoured), and thus should act as reference. These decisions directly influence strictness of the method and thus the number of products that have a characterising odour compared with reference products.
What this paper adds
The European Union Tobacco Products Directive 2014/40/EU is prohibiting the marketing of cigarettes and roll-your-own products with a characterising flavour other than the one of tobacco.
The Tobacco Products Directive does not specify how to practically distinguish between products with and without a characterising flavour.
We have developed a method to assess characterising odours in tobacco products for regulatory purposes using an expert panel.
Acknowledgments
The authors would like to thank Monica Aguayo Mendoza for her assistance with training the panel and performing the study; Jeroen Pennings for his assistance with the statistical program ‘R’; Eugène Jansen for his critical feedback on the manuscript; and the HETOC study for contributing to the development and application of the methodology used in this paper.
References
Footnotes
Contributors RT obtained study funding. All authors participated in the HETOC consortium and contributed to the study design and final HETOC report. MPL carried out the experimental work and data analysis. EJZK drafted the manuscript.
Funding The HETOC study was funded under the EU Health Programme (2008–2013) in the frame of a service contract with the Consumers, Health, Agriculture and Food Executive Agency (CHAFEA) acting on behalf of the European Commission (contract number 20146202).
Disclaimer The views expressed in the study are those of HETOC consortium and do not necessarily reflect the official opinion of the Executive Agency or the European Commission.
Competing interests This manuscript is an adaptation of part of the report entitled ‘Mapping of best practices and development of testing methods and procedures for identification of characterizing flavors in tobacco products’ written by the HETOC Consortium, consisting of the same authors as the current manuscript.
Patient consent Not required.
Ethics approval The study was approved by the Medical Ethical Committee of Wageningen University (NL5077208114).
Provenance and peer review Not commissioned; externally peer reviewed.