Article Text

Abstract
Objective Smoking rates have been compared with a spring, requiring continuous downward pressure against protobacco forces, rather than a screw, which once driven down stays down. Quality antitobacco mass media campaigns put downward pressure on smoking rates. The suspension of a major Australian state campaign provided a natural experiment to assess effects on smoking. Furthermore, we document the positive influence of robust monitoring and mature advocacy on the political decision to reinstate funding. We also document the misuse by industry of South Australian smoking data from the period between Australia’s implementation and subsequent evaluation of plain packaging.
Methods A time series analysis was used to examine monthly smoking prevalence trends at each of four intervention points: (A) commencement of high-intensity mass media campaign (August 2010); (B) introduction of plain packaging (December 2012), (C) defunding of campaign (July 2013); and (D) reinstatement of moderate-intensity campaign (July 2014).
Findings The suspension of the antitobacco campaign was disruptive to achieving smoking prevalence targets. There was an absence of a downward monthly smoking prevalence trajectory during the non-campaign period. Moreover, there was a significant decline in smoking prevalence during the period of high-intensity advertising, which continued after the introduction of plain packaging laws, and at the recommencement of campaign activity.
Conclusions While the observed declines in smoking prevalence are likely due to a combination of interventions and cannot be attributed exclusively to antitobacco advertising, the results reinforce the political decision to reinstate the campaign and demonstrate the need for maintained investment to keep downward pressure on smoking rates.
- smoking prevalence
- anti-tobacco campaigns
- survey
- policy
This is an open access article distributed in accordance with the Creative Commons Attribution Non Commercial (CC BY-NC 4.0) license, which permits others to distribute, remix, adapt, build upon this work non-commercially, and license their derivative works on different terms, provided the original work is properly cited and the use is non-commercial. See: http://creativecommons.org/licenses/by-nc/4.0/
Statistics from Altmetric.com
Introduction
Well-resourced antitobacco mass media campaigns are integral to comprehensive tobacco control strategies1 and are effective in reducing smoking prevalence.2 3 The effects of campaigns on behaviour change are likened to a spring, requiring ongoing downward pressure due to opposing (prosmoking) forces, rather than a screw, which once driven down stays down.4 To achieve sufficient impact, antitobacco campaigns require sustained investment to achieve repeated population-level exposure.5 The minimum threshold is 400 television audience rating points (TARPs) per month6 with accelerated declines in smoking from greater TARPs.7 Sufficient ongoing campaign exposure is important for maintaining increased quit attempts,8 antitobacco attitudes9 and accessing smoking cessation support.10
Because of the investment required, campaigns are typically government funded. While costly up-front, campaigns are efficient population-level interventions.4 11 12 Nevertheless, maintaining campaign funding is an ongoing challenge with governments reallocating their scarce resources.13 14 This study explores what happened to smoking rates during a long-term antitobacco campaign, which comprises four phases: low investment from 2008 to mid-2010 (infrequent bursts of campaign activity averaging 400 TARPs each), substantial investment for 3 years (averaging 700 TARPS per month), complete deinvestment for 1 year and then partial ongoing reinvestment (averaging 400 TARPs per month over 2 years). This fluctuation in mass media investment occurred within the context of other tobacco control activity, the effects of which are difficult to disentangle over this limited time frame. This study provides an opportunity to observe the potentially disruptive effect that suspending the campaign had on smoking behaviour within this broader context.
The South Australian tobacco control environment
South Australia (SA) is a mature tobacco control market in its own right and a jurisdiction within Australia. In 2011, the SA Government committed to ambitious smoking prevalence targets (from 20.7% in 2010 to 15% by 2016)15 and prioritised substantial investments into antitobacco campaigns within its broader strategy. An investment of 700 TARPs per month commenced August 2010 and was supplemented by the Australian National Tobacco Campaign, which aired in short bursts during the same period (2011–2012). The SA campaign and strategy are evaluated using quarterly interim performance indicators, complementing a robust, 30-year duration, annual population smoking prevalence monitoring system, which reported declines from 20.5% (±1.7; 2010) to 16.7% (±1.6; 2012).16 Broader budgetary contraction led to abrupt termination of campaign investment in July 2013, short of achieving its prevalence target.17 Annual smoking prevalence increased to 19.4% (±1.7%) the following year.16
Presentation of the prevalence data to the then health minister, supported by the evidence base on the influence of campaigns in reducing smoking prevalence, led directly to the reinstatement of the campaign. In his media release, the minister said:
We can’t afford another year of smoking increases so that advertising funding will be reinstated. The recent rise in smoking rates has demonstrated the importance that anti-smoking advertising has in preventing people taking up the habit, and supporting those wanting to quit.18
The reinvestment was for 400 TARPs per month commencing July 2014. Consequently, almost 12 months passed with zero campaign funding from the state or federali governments.
Australian tobacco plain packaging legislation came into effect in December 2012, 6 months prior to the termination of the SA antitobacco campaign. The rise in annual smoking rates observed in SA in 2013 was used by the tobacco industry in Australia and internationally to propagate the argument that plain packaging was ineffective.19–23 Changes in annual smoking rates are not precise enough to disentangle the effects of multiple interventions over the short term. Therefore, monthly smoking prevalence data were examined to facilitate a retrospective analysis of the investment and deinvestment in the campaign while accounting for other interventions such as plain packaging and tax increases.
Method
The South Australian Monitoring and Surveillance System is a cross-sectional population health monitoring tool used by SA Government. Each month approximately 600 telephone interviews are obtained from households randomly selected from the Electronic White Pages. Up to six call-backs are made to the selected households, and there are no replacements for non-contactable persons. Smoking questions are asked of participants aged 16 years and over. Data are weighted by age, sex and area (metropolitan/rural) of residence to reflect the structure of the SA population and probability of within household selection. Data were collected monthly from January 2008 to December 2016, giving a total sample size of 52 543 or approximately 487 respondents per month.
Monthly smoking prevalence was calculated from responses to: which of the following best describes your smoking status?: (1) I smoke daily, (2) I smoke occasionally, (3) I don’t smoke now but I used to, (4) I’ve tried a few times but never smoked regularly and (5) I’ve never smoked. Smoking prevalence was defined as a proportion of current smokers (respondents answering 1 or 2) in the total population. Potential changes in smoking prevalence trends that corresponded with campaign funding decisions were explored using an interrupted time series analysis (see online supplementary notes for further details). An ARMA(3, 1) model, that is, third-order Autoregressive and first-order Moving Average model, was selected to examine monthly smoking prevalence trends between and at each of the following intervention points: (A) commencement of 700 TARPs per month (high-intensity; August 2010); (B) plain packaging implemented (December 2012); (C) end of high-intensity campaign (July 2013; lagged by 1 month); and (D) reinstatement of moderate-intensity campaign (400 TARPs, July 2014). Various tax (excise and customs duty) increases also occurred throughout the period: 25% in April 2010 and 12.5% annually from 2013 onwards. ‘Tax’ was represented in the analysis as a continuous index variable using quarterly Australian Tobacco Consumer Price Index data24 to reflect the increase in the price of tobacco over time.ii
Supplemental material
Results
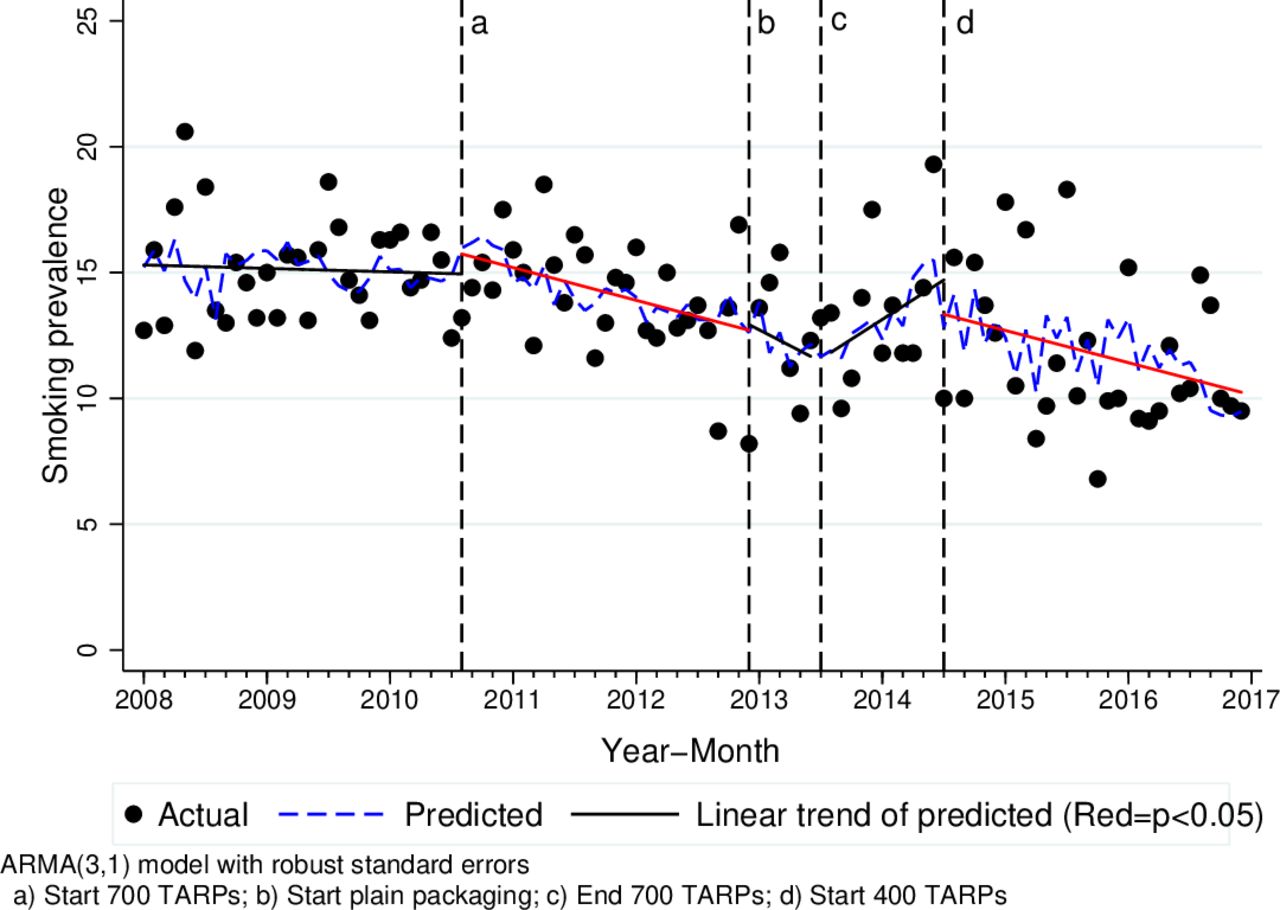
As shown in figure 1, there was no initial trend with time, but when the high-intensity campaign began in August 2010, the slope (point a to b) changed significantly from the previous period (p=0.029) and became significantly negative (β=−0.102; 95% CI β=−0.169 to −0.034, p=0.003). The negative slope was maintained after plain packaging (point b to c). Once the campaign ceased (point c to d), there was a non-significant trend upwards (β=0.304; 95% CI β=−0.06 to 0.672), with the change in slope significantly different from the high-intensity campaign period (p=0.032) but not the postplain packaging period (β=0.067; 95% CI β=−3.259 to 3.393, p=0.969). Finally, the commencement of the moderate-intensity campaign in July 2014 (point d) corresponded with a significant change in slope (p=0.025) and the trend in smoking prevalence (point d onwards) had a statistically significant negative slope (β=−0.109; 95% CI β=−0.172 to −0.047, p=0.001). The coefficient for ‘Tax’ was negative but was not statistically significant and was not included in the final model as the study was not powered to detect the individual effects of multiple interventions (see online supplementary notes for further details).
Time series analysis of monthly smoking prevalence from January 2008 to December 2016. ARMA(3, 1), third-order Autoregressive and first-order Moving Average model TARPs, television audience rating points.
Discussion
This natural experiment of what happens to smoking prevalence when a substantial antitobacco mass media campaign is suspended demonstrated that the withdrawal of mass media was associated with a disruption in achieving smoking prevalence targets. There was an absence of a downward monthly smoking prevalence trajectory during the period of no campaign. Moreover, there was a significant decline in smoking prevalence during the high-intensity campaign period, which continued after the introduction of plain packaging legislation, and at the resumption of campaign activity. These results are consistent with other studies demonstrating that adequately resourced, ongoing antitobacco campaigns correspond with accelerated declines in smoking prevalence2 7 and that quitting activity decays rapidly once campaign exposure ceases.8–10 The results from the monthly data reinforce the annual smoking data,16 and the political decision to reinstate the campaign.
These findings are consistent with analysis of national monthly smoking prevalence from (2001 to 2015) in Australia’s postimplementation review of tobacco plain packaging,25 which demonstrated an accelerated decline in smoking prevalence after implementation of the law. The results also contradict tobacco industry claims that plain packaging caused smoking to rise in SA, which cherry-picked SA data and used it out of context.
Robust annual monitoring systems are an efficient method of estimating smoking prevalence in populations, but they can be too infrequent for a policy environment that can change swiftly, and they lack precision for evaluating the effects of multiple interventions. Monthly monitoring can play a complementary role. Analysing trends in SA monthly smoking prevalence data has limitations. Most notable is the reliance on cross-sectional data and the small monthly sample sizes, which make overall and demographic subgroup trends difficult to identify due to large month-to-month fluctuations in smoking prevalence. Given the higher smoking prevalence among lower socioeconomic groups,16 investigating differential effects across socioeconomic subgroups would have been beneficial.
This study is limited by a modest monitoring period (9 years) and was underpowered to detect the effects of multiple tobacco control interventions, as has been done in larger studies.2 Consequently, the declines in smoking prevalence observed here are likely to be due to a combination of factors and cannot be attributed to antitobacco advertising exclusively. The tax index variable was included to control for the tax increases that occurred throughout the period but was not intended to represent the cost of cigarettes relative to income, which is a well-established contributor to declines in smoking.2 Furthermore, recruiting respondents via a landline telephone is becoming outdated as mobile phone-only households have increased from 5.2% in 2006 to 27.6% in 2013 in SA26 and was 36% nationally as of June 2017.27 Research shows that there is significant underestimation of smoking prevalence when mobile-only households are excluded from the sample.26 28 29 Therefore, the change in telephony status may have contributed to the declining smoking prevalence but may have contributed to an underestimation in the rate of increase during the absence of campaign activity.
Despite inherent limitations, monthly monitoring can complement more robust annual monitoring of smoking prevalence. These results validate the conclusion that terminating a mass media campaign was associated with a loss of progress in smoking reduction, and reinstatement of the campaign was associated with resumed progress. These results demonstrate the need for maintained investment to keep downward pressure on smoking rates. These findings also refute the myth propagated by industry, at the time and potentially in the future, that South Australian data provided evidence that plain packaging was ineffective and/or counterproductive.
What this paper adds
It is well established that quality antitobacco mass media campaigns lead to reductions in smoking.
This natural experiment demonstrated that suspending a major antitobacco campaign was associated with a disruption to the downward trajectory of smoking, and reinstatement of the campaign was associated with a resumption of progress.
These data demonstrate the immediate impact of a political decision to cease campaign funding and the power of good data to influence the policy decision to resume the campaign.
Contrary to industry claims, South Australian smoking rates did not increase immediately due to plain packaging.
References
Footnotes
↵i The mainstream National Tobacco Campaign had a burst of activity in April-June 2013 and did not air again until 31 May 2015. A non-mainstream campaign (‘More Targeted Approach’) aired nationally from 25 May to 27 July 2014.
↵ii Tobacco prices are collected monthly and aggregated and reported as quarterly changes in price; the index does not account for changes in household income or shifts in preferences for brands and pack sizes and therefore is not a measure of cigarette costliness.
Contributors All authors conceptualised and designed the study; JD and SK analysed the data; JD drafted the manuscript; CM and JB contributed to the interpretation of results and critically reviewed the manuscript; all authors approved the final version.
Funding The study was funded by Government of South Australia.
Competing interests None declared.
Patient consent Not required.
Ethics approval Ethics approval was provided by the University of Adelaide Human Research Ethics Committee.
Provenance and peer review Not commissioned; externally peer reviewed.
Correction notice This article has been corrected since it published Online First. It has been made Open access.