Article Text

Abstract
Objective To estimate health-adjusted life years (HALY) gained in the Solomon Islands for the 2016 population over the remainder of their lives, for three interventions: hypothetical eradication of cigarettes; 25% annual tax increases to 2025 such that tax represents 70% of sales price of tobacco; and a tobacco-free generation (TFG).
Design We adapted an existing multistate life table model, using Global Burden of Disease (GBD) and other data inputs, including diseases contributing >5% of the GBD estimated disability-adjusted life years lost in the Solomon Islands in 2016. Tax effects used price increases and price elasticities to change cigarette smoking prevalence. The TFG was modelled by no uptake of smoking among those 20 years and under after 2016.
Results Under business as usual (BAU) smoking prevalence decreased over time, and decreased faster under the tax intervention (especially for younger ages). For example, for 20-year-old males the best estimated prevalence in 2036 was 22.9% under BAU, reducing to 14.2% under increased tax. Eradicating tobacco in 2016 would achieve 1510 undiscounted HALYs per 1000 people alive in 2016, over the remainder of their lives. The tax intervention would achieve 370 HALYs per 1000 (24.5% of potential health gain), and the TFG 798 HALYs per 1000 people (52.5%). By time horizon, 10.5% of the HALY gains from tax and 8.0% from TFG occur from 2016 to 2036, and the remainder at least 20 years into the future.
Conclusion This study quantified the potential of two tobacco control policies over maximum health gains achievable through tobacco eradication in the Solomon Islands.
- low/middle-income country
- taxation
- surveillance and monitoring
- endgame
Statistics from Altmetric.com
Introduction
Cigarette smoking is one of the leading behavioural risk factors for poor health outcomes and premature death.1 Eighty per cent of all tobacco-related deaths occur in low/middle-income countries (LMIC), posing significant societal and public health challenges to the already stretched economies and health systems.2 The World Health Organization (WHO) has set a goal to achieve a 30% relative reduction in the prevalence of current tobacco use by 2025.3 To facilitate its achievement, WHO’s Framework Convention on Tobacco Control (FCTC) provides a package of evidence-based policy options,2 and has been ratified by 180 countries to date. However, the implementation of FCTC measures has proved challenging in LMICs.4
Computer simulation models can help track and forecast a nation’s progress towards smoking prevalence targets under current trends. Examples include cigarette smoking modelling from New Zealand,5 Brazil,6 China7 and several LMICs (online supplementary additional file 1). When simulation models are extended to include the impacts on disease morbidity and mortality rates, ideally also estimating composite measures of health gains such as health-adjusted life years (HALY), they can help prioritise between tobacco control interventions and other (eg, dietary) interventions.8 9 Interventions can also be ranked on cost-effectiveness and health budget impact when simulation models are further extended to include costs. Key examples include WHO’s Choosing Interventions that are Cost-Effective,10 Burden of Disease Epidemiology, Equity and Cost-Effectiveness Programme9 11 and Assessing Cost-Effectiveness in Prevention Study.12
Supplemental material
Models simulating HALYs and costs by time into the future require rich epidemiological data on population-level disease incidence, prevalence and mortality rates.9 Due to data limitations, only a handful of studies have estimated the impacts of tobacco control interventions on smoking prevalence and/or projected the future composite health effects (eg, HALYs gained) in LMICs, for example, Vietnam, Tanzania, Nicaragua and countries in Latin America (see online supplementary additional file 1 and refs 13–18). Alternatively, simpler models with lesser data requirements have simulated the impact of FCTC policies among LMICs onto the outputs of smoking prevalence and deaths prevented or averted (see online supplementary additional file 1 and refs 19–22). However, there are limitations to such simpler models as they may not incorporate time lags between exposure to tobacco and occurrence of health conditions, ignore the underlying business as usual (BAU) trends in future tobacco prevalence and do not allow comparisons with interventions beyond tobacco control based on HALYs gained.
The Solomon Islands has relatively high smoking rates (58% men/17% women 15–49 years old), and a high percentage of deaths attributed to smoking (21% men/12.8% women).23 The country has adopted the Tobacco-Free Pacific Goal that aims to reduce tobacco prevalence among adults to less than 5% by 2025,24 and has ratified the FCTC in 2004 and implemented a Tobacco Control Act in 201025—an Act that regulates tobacco advertising, promotion and sponsorship, prohibition of sale to children, smoke-free areas, display of health warnings and taxation. The Act was strengthened in 2013 by adopting evidence-based best practices of graphic warnings on cigarette packs.25 As of 2016, 28.9% of the retail price of cigarettes was tobacco excise tax—well short of the 70% recommendation by the WHO.25
The aims of this paper are twofold. First, we demonstrate the feasibility of applying smoking and disease epidemiological data from the Global Burden of Disease (GBD) for the Solomon Islands as inputs to a peer-reviewed and comprehensive tobacco simulation model that estimates intervention impacts on smoking prevalence and HALYs.9 11 Second, we quantify the impacts of three interventions: (1) a hypothetical one of eliminating cigarette smoking (to give the upper bound of all potential health gains from tobacco control); (2) 25% per annum tax increases to 2025 such that tax represents 70% of sales price of tobacco; and (3) a tobacco-free generation (TFG).
Methods
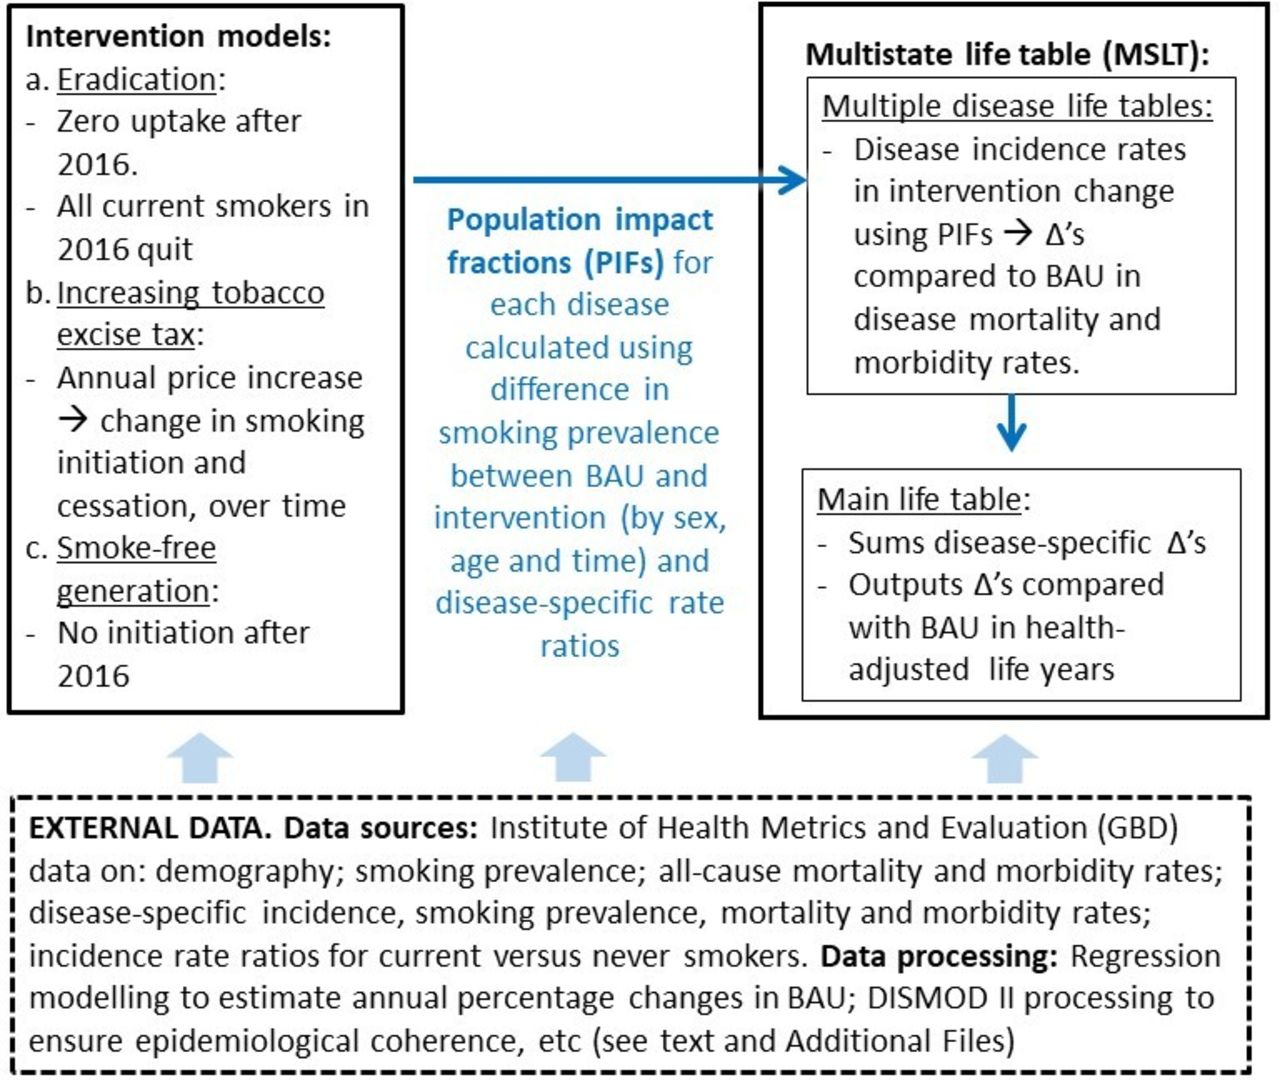
The overall modelling approach is shown in figure 1. There are two key model structure components: the intervention model that generates differences from BAU in cigarette smoking prevalence; and the multistate life table (MSLT) that estimates HALYs gained for intervention compared with BAU. These two components are linked by population impact fractions (PIF) that transmit the intervention impact to the MSLT. Finally, there are the data inputs needed to parameterise the above.
Conceptual overview of modelling. BAU, business as usual; GBD, Global Burden of Disease.
Intervention modelling
First, a BAU cigarette smoking prevalence was determined from a logistic regression model prediction from 2016 onwards (see table 1 and online supplementary additional files 2 and 4 for details). The three interventions created a counterfactual future smoking prevalence as follows:
Input smoking and epidemiological parameters and their sources for the base year (ie, 2016) and business as usual (ie, year 2017 onwards in the comparator)
Intervention 1: eliminating tobacco
In this hypothetical intervention, all current smokers were set to quit smoking in the baseline year of the model and annual smoking uptake rates were set to 0% from 2016 onwards.25
Intervention 2: tobacco taxation
In 2016, total taxes on cigarettes including specific excise (19.8%) and value-added tax (9.1%) in the Solomon Islands amount to 28.9% of retail value. To achieve 70% of the retail price being taxed by 2025, twenty-five per cent per annum increases in tobacco excise tax would be required from 2017 to 2025 (see online supplementary additional file 2). The resultant annual price increases were combined with price elasticity (PE) estimates to estimate changes in cigarette smoking prevalence.
Intervention 3: TFG
The TFG strategy involves a ban on the provision of tobacco to those born from a set year onwards.26 In this study, this strategy assumed a law change prohibiting the sale and supply of cigarettes27 to all individuals born from the year 1998 onwards, meaning that 20 year-olds in 2016 (and all younger cohorts) would never be able to legally access cigarettes. As such, annual smoking uptake rates among these cohorts were set to 0% from 2016 onwards.11
Population impact fractions
PIFs are the proportion reduction in disease incidence rates, for each sex, age and time step. They are calculated using the difference in cigarette smoking prevalence between BAU and the intervention, merged with disease-specific incidence rate ratios (RR).28 For example, imagine the BAU scenario smoking prevalence is 30%, but it reduces to 25% after an intervention. Assume that the incidence RR of coronary heart disease (CHD) for smokers compared with non-smokers is 2.5, and for simplicity (now) that there are no time lags between exposure change and change in CHD incidence. Then after the intervention, the CHD incidence rate will reduce by 5.2%, namely the PIF:

where pi is the prevalence distribution of smoking (ie, never smoker, ex-smoker and current smoker) before intervention, and pi′ is the postintervention prevalence distribution.
The model we use actually allows for time lags, such that quitters receive gradually reducing excess rates of disease over 20 years according to formulae in Hoogenveen et al’s study,29 then after 20 years are assumed to have the same disease incidence as never smokers.
MSLTs to estimate HALYs gained
The MSLT is a Markov model, simulating the 2016 population through annual states with transition probabilities determined by underlying epidemiology (eg, disease incidence and case fatality rates). The model is applied twice: once for BAU, and once for the intervention scenario. The key difference in the intervention scenario is the lowering of disease incidence rates using the PIFs, changing the ‘inflow’ of new cases and thus the cause-specific morbidity and mortality. Each disease is modelled in parallel life tables, assuming independence. The sum across all diseases of changes in morbidity and mortality rates is captured in the main life table, where differences between BAU and the intervention scenario in the number of living people (with attendant morbidity) are tallied up by annual cycle to give the gain in HALYs for the intervention over BAU summed up over all future annual cycles until everyone in the 2016 population has died off.
Disease selection for modelling
For parsimony, we restricted the cigarette smoking-related diseases to those individually contributing more than 5% of tobacco-related disability-adjusted life year loss in 2016 for the Solomon Islands from the GBD: CHD, stroke, lung cancer, chronic obstructive pulmonary disease (COPD) and lower respiratory tract infection. Collectively, these five diseases contribute 78% of the total disease burden attributed to smoking in Solomon Islands.30
Input parameters
As indicated in figure 1, external data inputs were used for all the above steps. Here we present it using a distinction between BAU, and then the intervention parameters needed to bring about changes in disease incidence rates through the PIFs.
Base year and BAU parameters
Base year demography (number of people by age and sex in 2016) and base year and BAU epidemiology (smoking prevalence, and disease incidence, prevalence, morbidity and case fatality rates in 2016) are detailed in table 1. Future smoking prevalence was extrapolated with trends to the end of each sex by age cohort’s lifespan, using coefficients from a logistic regression model on 1990–2016 Institute for Health Metrics and Evaluation (IHME) smoking prevalence data (table 1 and online supplementary additional file 4).
Disease-specific incidence, prevalence and case fatality (mortality rate divided by prevalence) rates for 2016 were taken from IHME GBD outputs (online supplementary additional file 3). In doing this, we noted that mortality rates exceeded incidence rates for CHD and stroke; while possible for some ages with strong decreasing past trends in incidence, the discrepancy was implausible. We therefore further ‘processed’ these GBD outputs through the epidemiological tool DISMOD II,31 with resultant coherent epidemiological parameter sets (that also calibrated well—below). These epidemiological parameters were extrapolated with trends for 15 years to 2031, then held constant (table 1). Disease-specific RRs for current versus never smokers were taken from IHME1 (online supplementary additional file 10).
Intervention parameters
As above, the intervention parameters were mostly straightforward: (1) zero smoking prevalence after 2016 for hypothetical eradication, (2) a 25% per annum excise tobacco tax increase from 2017 to 2025 inclusive,9 and (3) zero smoking prevalence for the cohort of people aged 20 (as this is the age at which initiation occurs in the model) in 2016 and younger (TFG strategy).11 The only noteworthy additional step is the use of price elasticities for the tax intervention, leading to additional reductions in smoking prevalence over and above BAU. Specifically, we started with the PE for smoking prevalence of −0.2 from SimSmoke for LMICs (Pakistan and Tunisia).19 Responsiveness to price, though, varies by age; we followed Levy et al 19 assuming that the ratios of PE in 15–20, 20–24 and 25–34 year-olds were four, three and two times (respectively) that among 35+ year-olds. Using the proportionate distribution of smokers in the Solomon Islands in these age groups in 2016, the PEs were set at −0.56, –0.42, −0.28 and −0.14 for 15–20, 20–24, 25–34 and 35+ year-olds, respectively.
Calibration
The intervention effect depends on changes in disease-specific mortality, which are not inputs to the model per se but rather outputs determined by input incidence, prevalence and case fatality rates. We therefore compared simulation model estimated disease-specific mortality rate estimates for 2021, 2026 and 2036 with regression-based forecasts (estimated outside of the simulation model) using 1980–2016 GBD data. The model calibrated within the level of tolerance set a priori at ±10% agreement for all diseases except some age groups for COPD (online supplementary additional file 5).
Analyses
Monte Carlo simulation with the Ersatz add-in (www.epigear.com) to Excel was used, with 2000 iterations of the model by randomly drawing from probabilistic uncertainty distributions about most input parameters (see table 1 for specification) to generate 95% uncertainty intervals (UI) around the HALY outputs.
Results
Descriptive data for the starting cohort in 2016 are presented in table 2. Prevalence of current smoking was three to four times higher among males than females across all age groups. Prevalence of current smoking peaked at 43.1% among 25–29 year-old males, and peaked at 13.7% among 50–54 year-old females.
Descriptive data for starting cohort in 2016
Projected smoking prevalence
Trends in the BAU scenario showed a decrease in age-specific smoking prevalence within each sex by age group over the 20-year period 2016–2036 (table 3). Under the annual 25% tax increase intervention, smoking prevalence reduced most notably at younger ages (due to greater price responsiveness). For example, for 20-year-old males best estimate of prevalence in 2036 was 22.9% under BAU, reducing to 14.2% under the tax intervention, a ratio of 0.62 (last column table 3). This pattern of greater reductions in future prevalence for younger ages was also seen for females, but at lower smoking prevalence.
Future smoking prevalence under business as usual (BAU) and projected smoking prevalence under interventions (95% uncertainty intervals in parentheses for BAU 2016)*, and ratio of smoking prevalence under tax intervention compared with prevalence under BAU
Future population health
Lifetime health gains from tobacco control interventions
Expected future HALYs in BAU, and incremental HALYs gained for the interventions, are shown in table 4. Eradicating cigarette smoking in 2016 would achieve 1510 (95% UI 910 to 2280) undiscounted HALYs per 1000 people alive in 2016.
Future HALYs per 1000 people under business as usual, and HALYs gained by eradication of tobacco, the tobacco tax intervention and tobacco-free generation (0% discount rate; 95% uncertainty intervals for HALYs gained in parentheses)*
The tax intervention would achieve 370 HALYs per 1000 (95% UI 177 to 630), or 24.5% of all potential health gains from the eradication of cigarette smoking. The TFG would achieve 798 HALYs per 1000 people (95% UI 403 to 1321; 52.5% of all potential gains). By sex, health gains were twice as great among males compared with females.
By age in 2016, HALY gains per 1000 people over the remainder of their lives for the eradication intervention were similar up to the age of 45 (in 2016), but then decreased for older cohorts in 2016 (table 4). The tax intervention had the greatest HALY gains among the youngest age cohorts in 2016, for example, nearly half of all HALYs gained in the tax intervention accrued among people aged 0–14 years in 2016. By design, health gains achieved from the TFG intervention are only accrued among those below 20 years of age in 2016.
Health gains from tobacco control interventions in the first 20 years after 2016
Eradicating tobacco in 2016 gave 104 and 162 HALYs per 1000 people that could be gained from tobacco control between 2016–2025 and 2026–2035, respectively (table 4). Together, health gains in the first 20 years after intervention were 17.6% of all potential realisable health gains over the remainder of the life of the 2016 Solomon Islands population ([104+162]/1510).
Of these 266 per 1000 potential HALYs obtainable in the first 20 years after intervention (2016–2035), 39 HALYs (15%) and 64 HALYs (24%) could be achieved through tax and the TFG interventions, respectively.
10.5% of the HALY gains from tax ([9+30]/370) and 8.0% of the gains from TFG ([15+49]/798) occur from 2016 to 2035.
Discussion
Summary of main results
Compared with BAU, simulated tax interventions and the TFG strategy reduced projected smoking prevalence. However, the projected prevalence from both interventions independently could not achieve the Tobacco-Free Pacific Goal of reducing adult cigarette smoking prevalence to lower than 5% by 2025. Men benefitted more than women for both interventions in terms of health gains (due to having higher baseline smoking rates), and for tobacco taxation children and adolescents derived most benefits per capita over the remainder of their lives. Using the HALYs gained from the tobacco eradication scenario as the ‘upper bound’ of all possible health gains available from tobacco control, we estimated that 15% and 24% of all potential health gains over the reminder of the lifespan of the Solomon Islands could be achieved through tax and the TFG interventions, respectively. By time horizon, about 10% of the health gains estimated from tobacco tax and a TFG are likely realised in the first 20 years after the intervention; the remaining 90% of gains occur 20+ years into the future.
Comparisons with previous study
One simulation study of tobacco control policies has included the Solomon Islands as one country in a multicountry study, using the Abridged SimSmoke model.21 It estimated an 8% reduction in smoking prevalence due to implementation of MPOWER strategies adopted between 2014 and 2017 (smoke-free places, cessation, health warnings (for which the Solomon Islands rates well in progress compared with other countries), marketing bans and taxes), and 4419 fewer smoking-attributable deaths over the remaining lifetime of Solomon Islands population. As useful as the SimSmoke evaluations21 are, including multiple countries and rapid methods, they are also limited in some ways: the calculation of deaths averted uses a simple extrapolation of the generalisation that half of all smokers die of smoking from the British doctors study—a ‘fact’ that is unlikely to be true in the future due to changing disease epidemiology; the metric of deaths averted does not convey the amount of (healthy) life years lost; and the Abridged Smoke evaluations (eg, refs 21 32) do not allow for future (likely) reductions in BAU smoking prevalence without intervention, overestimating the impact of interventions (the fuller SimSmoke evaluations do allow for BAU trends in smoking).7 33 34 By way of comparison, our study estimated increasing excise tax by 25% per year (to shift the percentage of retail price that is taxed from 19.8% to 70%) in the Solomon Islands would reduce smoking prevalence by approximately 10% for older smokers and nearly 40% for younger smokers—compared with a forecast BAU prevalence without tax scenario.
Strengths and limitations
Key strengths of our study include estimation of health gain in HALYs, and allowance for changes in future BAU tobacco prevalence, as above. Using equations from Hoogenveen et al’s study,29 we also allow for time lags from the change in smoking status to change in disease incidence.
We also specifically set out to build a prototype model using country-level IHME GBD data, allowing it to be more applicable across other countries. To our knowledge, only one study has used GBD disease data as inputs to a tobacco simulation model17 and none have used country-level tobacco data and its trends from 1980 to 2016 produced by GBD as data inputs. We designed a model that takes in 2016 GBD parameters for cigarette smoking prevalence, and disease incidence, prevalence and case fatality rates, and cigarette smoking-disease relative risks for an LMIC. We also undertook our own projections of future disease incidence and case fatality using simple regression models; importantly, IHME is producing projections of these parameters (mortality only at this point) that can be directly included, and used to update our approach in future models.35 36
However, there are limitations. First, future cigarette smoking prevalence in BAU could change drastically with further tobacco control regulations or alternative nicotine delivery systems (eg, e-cigarettes), altering the marginal effectiveness of tobacco tax and a TFG. Second, we have not explicitly modelled packages of interventions; such modelling of, say, a package of MPOWER measures compared with others is a fertile future research direction—and one already pursued by SimSmoke and a microsimulation modelling exercise in India.19 37 Third, the Solomon Islands also has high additional burden from smokeless tobacco use which is not included in the current model due to lack of relevant data.23 Model extensions to include smokeless, and alternative nicotine devices, would be valuable—although challenging. Fourth, we do not have comparative interventions conducted for the Solomon Islands for other preventive public health policies, for example, diet, alcohol and road traffic safety. While tobacco control decision-making may be made in isolation from other preventive interventions, ideally decision-making on policies to reduce the non communicable disease (NCD) burden should be made considering many possible preventive programmes. Fifth, our estimates of increase disease risk use relative risks for current versus never without allowance for the number of cigarettes smoked per day and pack-year history (although age-specific relative risks will address this to some extent). We note that the GBD has just updated its smoking attribution methods to using a direct method incorporating number of cigarettes and pack-years,38 which might be fruitfully harnessed in future simulation modelling methods.
Sixth, there is considerable uncertainty about price elasticities. Summarising global evidence, Chaloupka et al concluded that LMICs have price elasticities of overall cigarette consumption similar to, or even stronger than, the widely accepted −0.4 average of high-income countries.39 We used this as the starting point in our modelling, following Levy et al’study.19 However, a recent econometric study20 of price elasticities in Asia-Pacific countries using Euromonitor data for price and consumption, by country by year, found that, for a grouping of seven countries with similar gross national income including the Solomon Islands, the PE for cigarette consumption was −0.146 (95% CI −0.320 to 0.028). If the PE is really weaker in the Solomon Islands, then we will have overestimated prevalence reductions and HALY health gains. However, studies such as this one20 are limited by endogeneity (they used previous years’ tobacco price as an instrument) and the reliance of aggregate-level data. Hence, we believe the −0.2 PE estimate for smoking prevalence (commonly set at half the PE for overall cigarette consumption, i.e. -0.4) we based our estimates on is probably ‘best’ at this point.
Finally, regarding the TFG intervention specifically, we acknowledge that successful implementation is threatened by two aspects: complete compliance by tobacco retailers; and restricting social supply through friends, acquaintances and siblings. Research from nations where the minimum legal age for tobacco has previously been raised (which would progressively happen each year under the TFG strategy) suggests that illegal supply by retailers to minors was not problematic, as long as a new law was accompanied by a strong enforcement system with a good surveillance system and sufficiently high penalties in case of violations.40
Implications for future research
As evident from the limitations above, there are multiple future research priorities to improve the quantification of health impacts of potential interventions—be it tobacco tax, other tobacco interventions or prevention of NCDs more widely. A logical next step following this modelling is to include costs of both the intervention and smoking-attributable diseases, to estimate the cost-effectiveness of the interventions considered. Few disease costing studies exist for LMICs as compared with the available healthcare expenditure data from high-income countries. Unlike the GBD epidemiological data, no similar disease cost database exists for high, middle and low-income countries that can provide disease-specific healthcare expenditures for each country. A recent study41 attempted to estimate the economic cost of smoking-attributable diseases in countries around the world, including LMIC settings, using the WHO Global Health Expenditure database42 and estimating a smoking-attributable fraction for expenditures. This is a promising approach that could make use of the health expenditure data available to 2015 for more than 190 WHO Member States and could also be applied to other disease areas.
Conclusion
The MSLT model provides information on smoking trends into the future and quantifies the impacts of two tobacco control interventions that could accelerate progress towards achieving the Tobacco-Free Pacific Goal for the Solomon Islands. Additionally, this project is a ‘test of concept’ for a new generation of simulation modelling, leveraging off the GBD data with the potential for intervention impact modelling in multiple countries simultaneously. An important next step would be to capture costs for carrying out cost-effectiveness analysis to further assist policy prioritisation.
What this paper adds
What is already known on this subject
Low/middle-income countries (LMIC), including the Solomon Islands, face significant tobacco-related public health burden. Computer simulation models can help track and forecast a nation’s progress towards smoking prevalence targets under current trends.
Modelling health-adjusted life years gained due to tobacco control interventions require rich tobacco and epidemiological data.
What important gaps in knowledge exist on this topic
Application of country-level cigarette smoking and epidemiological data from the Global Burden of Disease (GBD) study as inputs to simulation models for LMICs.
Effectiveness of increased tobacco taxation and tobacco-free generation (TFG) in achieving Tobacco-Free Pacific Goal (<5% prevalence by 2025) in Solomon Islands.
What this paper adds
Neither large tobacco tax increases nor a TFG intervention will be enough to achieve the Tobacco-Free Pacific Goal in the Solomon Islands.
This study demonstrates the application of simulation modelling using GBD data in a low/middle-income setting.
References
Footnotes
Contributors AS contributed to acquisition of data, analysis, interpretation of data and drafting of the manuscript. FSPvdD contributed to analysis, interpretation of data and providing critical feedback on the manuscript. NC contributed to interpretation of data and providing critical feedback on the manuscript. ADL contributed to conception of the project and providing critical feedback on the manuscript. TB led the conception of the project and design, analysis, interpretation of data and oversaw the drafting of the manuscript.
Funding Funding for this project was provided by Melbourne School of Population and Global Health, University of Melbourne, and a Health Research Council of New Zealand, Programme Grant ‘BODE3: Modelling preventive interventions to improve health and social outcomes’ (16/443).
Competing interests None declared.
Patient consent for publication Not required.
Ethics approval This study analysed existing publicly available modelled output data for Solomon Islands population from the Global Burden of Disease study. Ethics approval was not required as data were not collected from any participants.
Provenance and peer review Not commissioned; externally peer reviewed.
Data availability statement Data are available in a public, open access repository. The data sets generated and/or analysed during the current study are available in the (IHME’s Global Burden of Disease study) repository (http://ghdx.healthdata.org/gbd-results-tool and https://cloud.ihme.washington.edu/index.php/s/jWq9BL54CcyzuMz?path=%2FGBD2016Covariates).