Article Text

Abstract
Background Adult smoking prevalence in Minnesota fell from 21.8% in 1997 to 15.2% in 2016. This reduction improved heart and lung health, prevented cancers, extended life and reduced healthcare costs, but quantifying these benefits is difficult.
Methods 1.3 million individuals were simulated in a tobacco policy model to estimate the gains to Minnesotans from 1998 to 2017 in health, medical spending reductions and productivity gains due to reduced cigarette smoking. A constant prevalence scenario was created to simulate the tobacco harms that would have occurred had smoking prevalence stayed at 1997 levels. Those harms were compared with tobacco harms from a scenario of actual smoking prevalence in Minnesota from 1998 to 2017.
Results The simulation model predicts that reducing cigarette smoking from 1998 to 2017 has prevented 4560 cancers, 31 691 hospitalisations for cardiovascular disease and diabetes, 12 881 respiratory disease hospitalisations and 4118 smoking-attributable deaths. Minnesotans spent an estimated $2.7 billion less in medical care and gained $2.4 billion in paid and unpaid productivity, inflation adjusted to 2017 US$. In sensitivity analysis, medical care savings ranged from $1.7 to $3.6 billion.
Conclusions Minnesota’s investment in comprehensive tobacco control measures has driven down smoking rates, saved billions in medical care and productivity costs and prevented tobacco related diseases of its residents. The simulation method employed in this study can be adapted to other geographies and time periods to bring to light the invisible gains of tobacco control.
- economics
- prevention
- public policy
This is an open access article distributed in accordance with the Creative Commons Attribution Non Commercial (CC BY-NC 4.0) license, which permits others to distribute, remix, adapt, build upon this work non-commercially, and license their derivative works on different terms, provided the original work is properly cited, appropriate credit is given, any changes made indicated, and the use is non-commercial. See: http://creativecommons.org/licenses/by-nc/4.0/.
Statistics from Altmetric.com
Introduction
Coast-to-coast efforts to combat the tobacco epidemic in the USA since the initial Surgeon General’s report on the consequences of smoking1 have reduced US adult smoking prevalence from 42.4% in 1965 to 15.5% in 2016.2 3 Minnesota has been at the forefront of many tobacco control policies, including being the first state to enact clean indoor air legislation, one of a few states that taxes e-cigarettes as tobacco products and one of the first to sue tobacco companies when it joined with Blue Cross and Blue Shield of Minnesota to recover financial damages from tobacco use in the state, creating public access to internal tobacco company documents in the process.4 Adult smoking prevalence in Minnesota fell from 21.8% in 1997 to 15.2% in 2016.5 These estimates represent 30% declines in per-capita cigarette use in less than 20 years, a substantial public health achievement that sets the stage for improved population health for decades to come.
These declines are not surprising. Significant policy change restricting tobacco sales and use occurred during this period. ClearWay Minnesota was established in 1998 through Minnesota’s state tobacco settlement to implement tobacco control programmes and research.6 Minnesota increased its investment in tobacco control by raising per-capita expenditures from $0.45 in 1997 to a high of $6.71 in 2003.7 The state tax on a pack of cigarettes increased from $0.48 in 1997 to $3.34 in 2014 while the after-tax retail price of a pack of cigarettes rose from $2.17 to $8.16.8 And in 2007, statewide, comprehensive indoor clean air legislation was passed,9 born out of earlier local ordinances.
The damaging health and economic effects of tobacco use are well established,10 and it seems clear that the reduction in smoking prevalence in Minnesota has brought meaningful benefits. However, heart attacks that never happened, cancers that were never diagnosed because they never occurred and delayed deaths cannot be counted. It is difficult to quantify these invisible gains because we cannot directly compare the progress that has been achieved over the last 20 years to an alternative Minnesota where the heart attacks, cancers and premature deaths did occur.
Simulation models are often employed to address such circumstances. Tobacco simulation models have been used to estimate the impact of specific state polices,11 and synthetic cohort methods have been used to estimate the impact of state tobacco control programmes by creating a counterfactual no-programme scenario through statistical comparison of states’ experiences.12–14 In contrast, we estimated the impact of all sources of prevalence decline in Minnesota from 1998 to 2017 by simulating a hypothetical scenario with smoking prevalence held constant at 1997 levels and comparing it to a scenario with actual smoking prevalence trends. Employing a simulation model allows us to estimate a wide range of downstream effects of reduced prevalence, including prevented disease events and deaths, medical costs saved and productivity gains. We compared the estimated health and economic consequences of cigarette smoking realised from 1998 to 2017 from these two scenarios to quantify the gains that Minnesotans have achieved by reducing cigarette smoking over 20 years. By quantifying the invisible gains from reduced smoking prevalence, our results bring to light what has been achieved in Minnesota since 1998 and help inform future policy decisions on tobacco control.
Methods
We developed ModelHealth: Tobacco MN—a microsimulation model to assess the health and economic impact of cigarette smoking in Minnesota. The model is based on the HealthPartners Institute’s ModelHealth: Tobacco.15 In the health policy context, a microsimulation model is a computer model that simulates individual people to estimate the trajectory of a specific set of health outcomes under different programme or policy scenarios. The HealthPartners Institute’s ModelHealth: Tobacco MN focuses on lifetime cigarette smoking behaviour and its health and economic consequences. The model simulates yearly outcomes through a series of probabilities of changing tobacco use behaviours and corresponding health risks, societal medical costs and productivity losses as summarised below with additional detail provided in online supplement 1. We did not discount future outcomes to present value because the analysis does not compare expenditures with future benefits.
Supplemental material
Demographics and insurance status
We chose 1997 as our base year to assess the 20 years of change from 1998 to 2017. We specified ModelHealth: Tobacco MN by modifying the population demographics, smoking behaviour risk equations, risk of smoking-attributable diseases, deaths, healthcare costs and productivity in the original US version of ModelHealth: Tobacco.15 We populated the model with simulated individuals representative of the Minnesota population in 1997 in terms of age, sex, race/ethnicity and educational attainment.16 Overall, 1.3 million individuals were simulated, providing approximately one simulated person for every four Minnesotans. Simulated individuals are also assigned disability, employment and poverty status using relationships between demographics that we estimated for the USA as a whole from US Current Population Survey16 and the Survey of Income and Program Participation.17 These characteristics partially determine their primary type of insurance.
Cigarette smoking
We approximated the associations between demographics and smoking status of youth in 1997 using de-identified Minnesota Youth Tobacco Survey (MYTS) responses provided by the Minnesota Department of Health from the first MYTS survey in 2000.18 In subsequent years, we used ‘net initiation’ to combine the probabilities that a non-smoking youth becomes a smoker during the year and that a youth who is a regular or experimental smoker becomes a non-smoker. MYTS data include middle and high school students. Age trends were extrapolated to age 9 and youth prevalence reported in results includes ages 9–17.
We estimated adult cigarette smoking status in 1997 from self-report of the Minnesotans who responded to the 1996 or 1997 Behavioral Risk Factor Surveillance Surveys (BRFSS).19 For ages 65 and older, we calibrated the initial smoking prevalence derived from BRFSS to be consistent with that from the first Minnesota Adult Tobacco Survey (MATS) in 1999.20 This was done to create internal consistency with the realised prevalence scenario as described below. We estimated cessation rates for adults 25 and older from combined 1996 and 1997 BRFSS responses. Too few Minnesotans ages 18–24 were represented in the BRFSS to yield reliable estimates of cigarette smoking status. Therefore, we applied a simplifying assumption that cigarette smoking status from ages 18–24 was the same as 25-year-olds. In effect, the model uses a peak lifetime tobacco prevalence that is nearly constant from ages 17 to 25. This simplification has little impact on estimates of the health and economic impacts of tobacco use during the next 20 years due to the relatively low tobacco harms among young adults.10 21 The longer a person has successfully quit smoking, the less likely he or she is to relapse. We constructed a relapse curve, described in online supplement 1, based on retrospective and prospective studies and reviews.22–26
Consequences of cigarette smoking
The model includes smoking-attributable diseases identified in the updated Smoking-Attributable Mortality, Morbidity, and Economic Costs (SAMMEC) estimates.10 We obtained deaths from smoking-attributable conditions for Minnesota by age group and sex in 1996–1998 from Detailed Mortality Data.27 We further disaggregated these rates into never, current and former smokers using Minnesota adult smoking prevalence and relative risks of disease from the 2014 Surgeon General’s Report.10 State-specific non-fatal disease events are not readily available by sex and detailed age group. Therefore, we first calculated case-fatality rates for US adults by age group and sex using the US version of ModelHealth: Tobacco. We then multiplied age-specific and sex-specific fatality rates for Minnesotans by the inverse of these case-fatality rates (eg, lung cancer cases i,j,/ lung cancer deaths i,j , where i=age group, j=sex) to approximate smoking-attributable event risks for Minnesotans.
Smoking-attributable medical costs measure the additional total cost of medical care of current and former smokers that are in excess of those of never smokers. We approximated smoking-attributable medical costs of Minnesotans by age group and sex. We scaled estimates for current smokers that we derived for the USA from 2000 to 2010 linked Medical Expenditure Panel Survey (MEPS) and National Health Interview Survey data28 using the ratio of Minnesota to US per-capita healthcare expenditures.29 We inflation-adjusted these costs to 2017 US$.
MEPS and other claims data include former smokers with high utilisation who quit smoking only after developing a condition that leads to increased healthcare utilisation in the years following their successful quits.30–33 Therefore, for former smokers, we fit an exponential function to the relationship of current and former expenditures based on time since quit, using the relationship between current and former smoker health risks as provided in online supplement 1 34.
In the model, productivity losses reflect absence from work,35 lower productivity at work35 and lost years of work, including unpaid household productivity.36 Similar to medical costs, we scaled US measures of productivity by the ratio of Minnesota to US per-capita earnings,37 applied the exponential function to estimate productivity losses of former smokers as a function of time since cessation and inflation-adjusted productivity to 2017 US$.
Simulation scenarios
We constructed two simulation scenarios. For the ‘constant prevalence scenario’, we calibrated the model to keep smoking prevalence from 1998 to 2017 at the baseline 1997 rate. We created a ‘realised prevalence scenario’ by calibrating the model to create the smoking prevalence trend indicated by MATS and MYTS data from 1998 to 2017. Population prevalence is determined within the simulation model by changes to each simulated individual’s smoking status. Therefore, we calibrated the model’s initiation and cessation rates to create these scenarios.
In the constant prevalence scenario, we did not calibrate net-initiation for youth. Modelling youth initiation as ‘net initiation’ as described above produces relatively stable prevalence rates over time without calibration. For adults, we maintained smoking prevalence at the baseline 1997 rates by multiplying cessation probabilities by a constant that is less than one. We identified year-specific constants that produced annual prevalence rates for adults that stay within the baseline 1997 prevalence rate by a relative 2% (ie, in the range of 23.3% and 24.3% when calibrating to the 1997 23.8% prevalence rate). To ensure a reasonable age distribution of current and former smokers, we scaled cessation in four age groups: 18–24, 25–44, 45–64 and 65+. For each age group, we allowed the calibrated prevalence rate to vary by up to a relative 10% and an absolute 1.0 percentage points from the 1997 baseline rate while keeping the overall adult prevalence rate within a relative 2%. This calibration maintains initiation at 1997 rates and reduces cessation rates among adults. This holds current smoking prevalence constant by reducing the number of former smokers relative to actual trend.
To calibrate the realised prevalence scenario, we scaled initiation and cessation rates by age group to match the prevalence trends as tabulated from MATS surveys.20 MATS surveys were conducted in 1999, 2003, 2007, 2010 and 2014. For non-survey years, we calibrated the realised prevalence scenario to trend lines that we fit to age-group specific prevalence rates in the survey years. For some age groups, the best fitting trend line implied a prevalence rate higher than the model baseline rate during the late 1990s. In such cases, we did not calibrate to the trend line until the first year that the trend line fell below the baseline prevalence rate. For individuals ages 65 and above, MATS survey responses produce smoking prevalence rates more than 50% higher than those from BRFSS. Therefore, to maintain internal consistency, we rescaled the base model rates for ages 65 and above to be consistent with trends estimated from MATS. The impact of this calibration is to allow the lower initiation rates of more recent birth cohorts to reduce adult initiation over time, and then to modify adult prevalence trends as necessary by fine-tuning cessation rates. Therefore, the realised prevalence scenario has more of both never smokers and former smokers, compared with the constant prevalence scenario.
Sensitivity analysis
In sensitivity analysis, we explored the influence of important model parameters on disease events, deaths, medical care costs and productivity. We changed the probability that a current smoker will quit within a year by multiplying each simulated smoker’s chance of quitting by 1.25 and 0.75. This sensitivity analysis explores the potential impact of any systematic bias in measuring cessation probabilities by 25% in either direction.
We simultaneously changed the risk of disease of former and current smokers relative to their never-smoker counterparts. The relative risks of each disease were multiplied by 1.25 and 0.75. This sensitivity analysis explored the potential impact of any systematic bias by 25% in either direction that may occur from three different sources: (1) in the methods or data sources for estimating the relative risk of disease, (2) in applying the relative risks that were estimated based on observed deaths by smoking status to both fatal and non-fatal cases in the model and (3) in our approximation of the smoking-attributable disease risks of Minnesotans for the model.
We multiplied the medical care costs of current and former smokers by 1.35 and 0.65 to explore any systematic bias of up to 35% in estimating these costs. The model’s costs are based on MEPS data, which produce 7% to 18% lower estimates of healthcare costs than National Health Expenditure Accounts, principally because MEPS excludes military personnel and residents of long-term care facilities, and some categories of payments such as non-prescription drugs and payments to institutions that are not for the care of a specific patient.38–40 Therefore, it is more likely that the model’s cost-savings are understated than overstated. We also explored the impact of alternative estimates of the costs of smoking that we derived to support the 2014 Surgeon General’s Report.21 These costs are in closer alignment with costs based on National Health Expenditure Accounts, but they are not differentiated by insurance status.
Results
The estimated cumulative impact of smoking during all years from 1998 to 2017, with and without decreases in prevalence since 1997, are summarised in table 1. Additional detail is provided in online supplement 2. Annual differences for key outcomes are shown in figures 1–3. From a starting prevalence rate of 13.4% in 1997, cigarette smoking prevalence among youth 9 to 17 years old declined by 9.4 percentage points when we project trends from MYTS surveys forward to 2017. For adults over all, prevalence started at 23.8% in 1997 and declined by an estimated 10.0 percentage points. In relative terms, youth and adult smoking fell by 70% and 40%, respectively. Cigarette smoking fell among all adult age groups. The largest change occurred in the age groups with the highest prevalence rates in the 1997 baseline year.
Supplemental material

Minnesota cigarette smoking prevalence, by age group, in realised prevalence scenario.

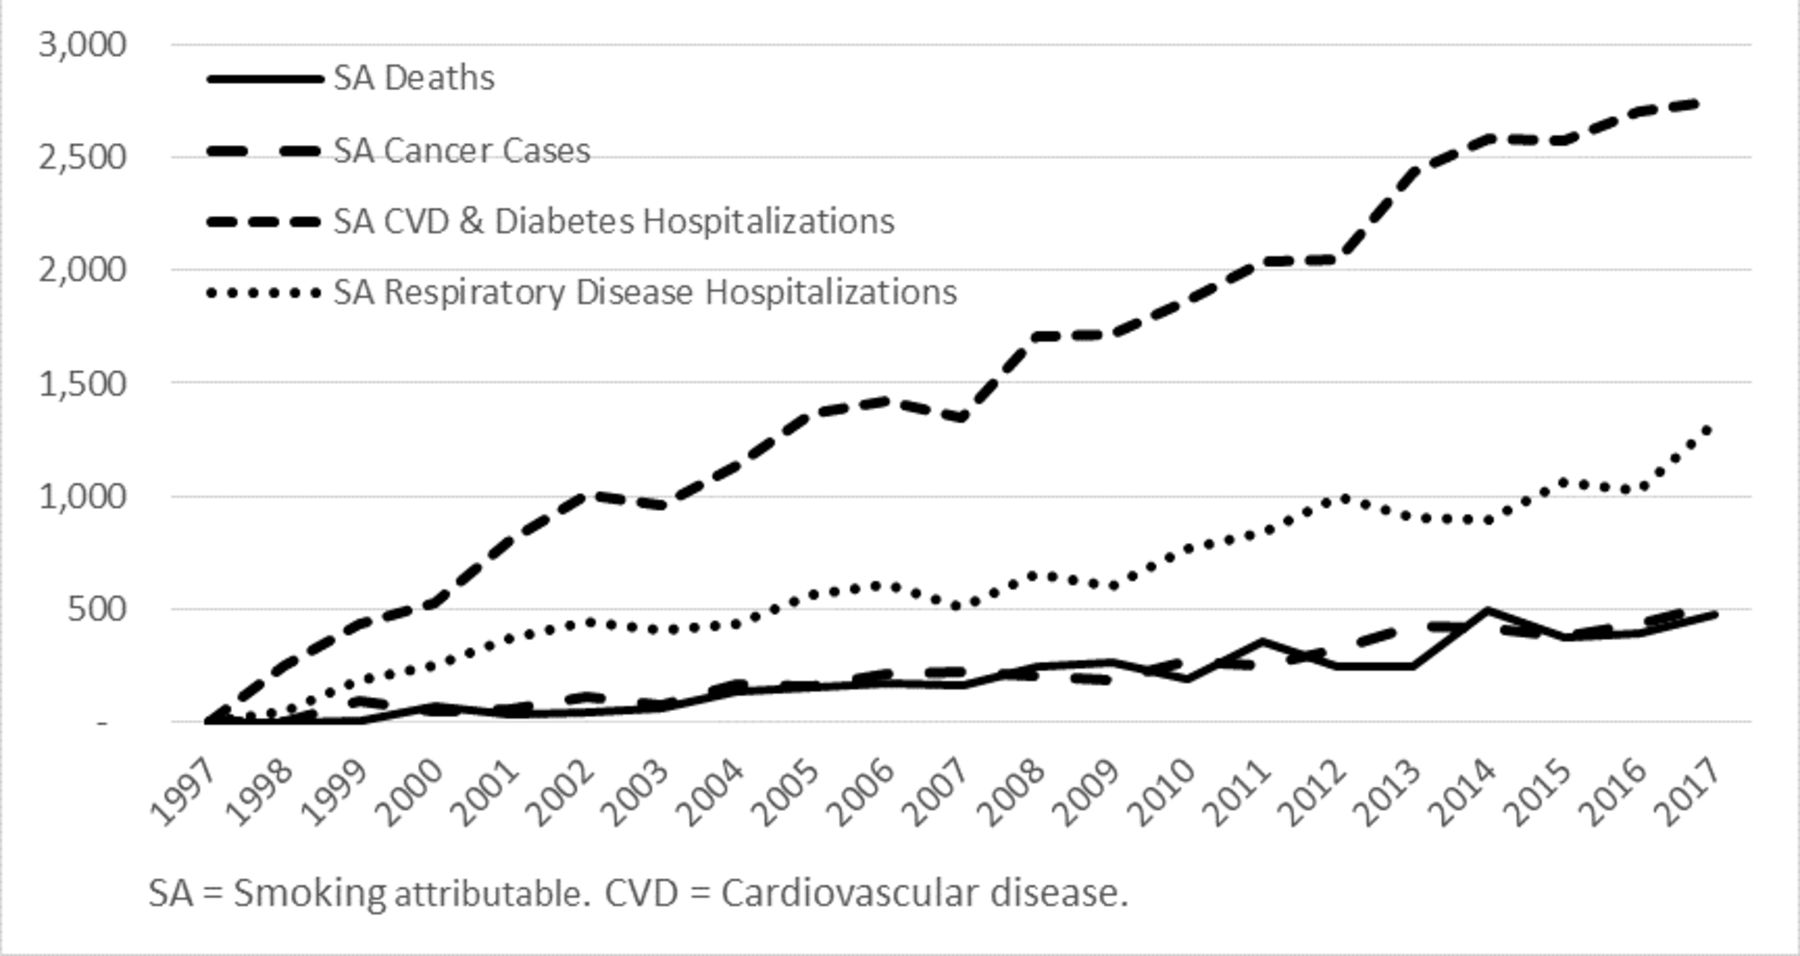
Minnesota annual smoking-attributable health events prevented through reduced cigarette use.
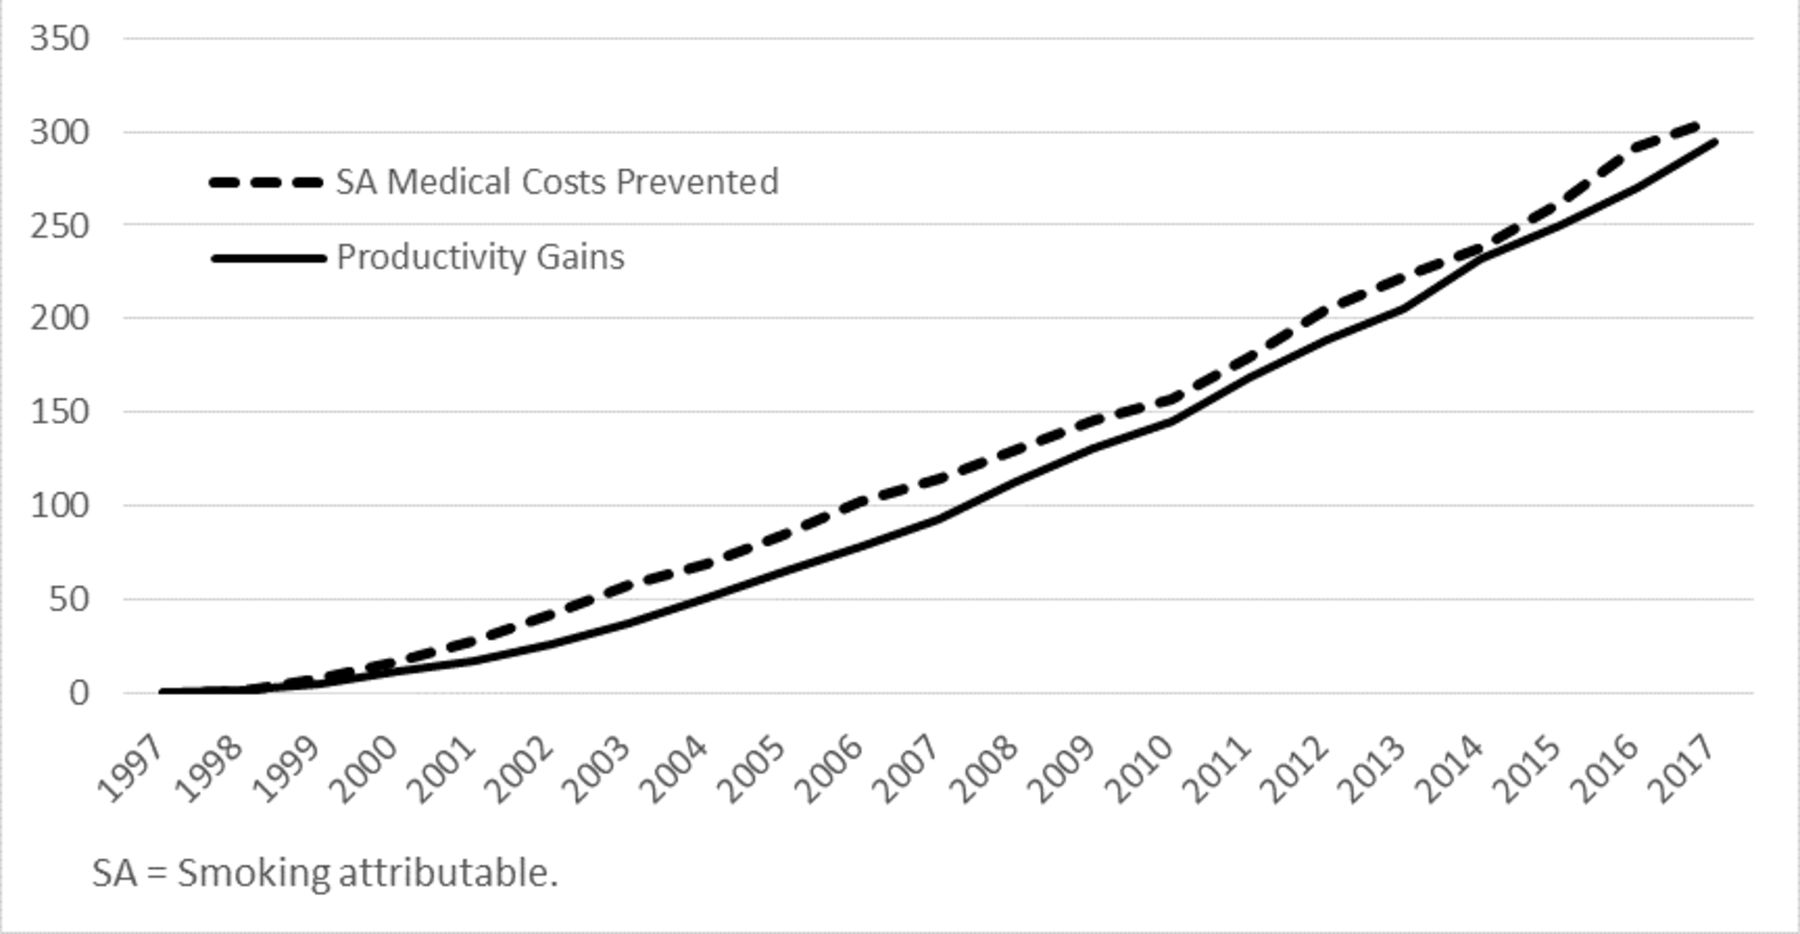
Annual gains in economic outcomes from reduced smoking prevalence (million US$, 2017).
Results summary: cumulative impact of reducing smoking prevalence, Minnesota 1998–2017
For each of the disease event categories in the simulation, the annual reduction in events increases over time (figure 2). By 2017, the model estimates there were 519 fewer new cancer cases, 2750 fewer cardiovascular disease (CVD) and diabetes hospitalisations, 1317 fewer respiratory disease hospitalisations and 478 fewer deaths in Minnesota than there would have been without reductions in smoking prevalence. Over the 20-year period of reduced smoking, the corresponding cumulative reductions were 4560 cancer cases, 31 691 CVD and diabetes hospitalisations, 12 881 respiratory disease hospitalisations and 4118 deaths.
By 2017, the estimated annual medical cost savings and productivity gains from reduced cigarette smoking were both approximately $300 million measured in 2017 US$ (figure 3). The combined medical savings and productivity gains totalled $273 per household in Minnesotan in 2017 alone. The cumulative gains over 20 years of declining smoking prevalence were $2.7 billion in medical costs and $2.4 billion in productivity gains.
Results of the sensitivity analysis are shown in table 2. Relative to the base case estimates, disease events and deaths prevented changed in nearly the same percent as the changes in the relative risks of disease (±25%). In the model, changes to the disease relative risks only impact medical costs to the extent that years of life lived as a current or former smoker are impacted by disease risk. This is because smoking-attributable medical costs are not tabulated as costs per disease event (see the Methods section). The scenarios with 35% changes to per-person smoking-attributable medical costs and productivity values result in proportional changes to costs saved and productivity gains. Applying smoking-attributable costs that were calculated using an alternative method increases estimates of medical savings by 9%. In multivariate sensitivity analysis (not shown), we simultaneously changed disease relative risks, medical costs and productivity costs, while also assuming that a 25% change in relative risks of disease changes medical costs by another 25%. The resulting range of smoking attributable medical costs saved was $1.3 to $4.5 billion, and the range of productivity gains was $1.4 to $3.5 billion.
Sensitivity analysis of estimates of the impact of decreased smoking prevalence in Minnesota, 1998–2017
Discussion
Our simulation model estimates that reducing cigarette smoking from 1998 to 2017 in Minnesota prevented 4560 cancers, 31 691 hospitalisations for CVD and diabetes, 12 881 respiratory disease hospitalisations and 4118 smoking-attributable deaths. Minnesotans saved an estimated $2.7 billion in medical care and gained $2.4 billion in paid and unpaid productivity. All benefits from reduced smoking are increasing over time. During the last 5 years (2013–2017) of the 20-year period, the impacts are four or more times higher than during the first 5 years (1998–2002).
Our estimates include the health and economic gains realised from 1998 to 2017 as a result of reductions in smoking prevalence below 1997 levels. Tobacco control policies that reduced youth initiation before 1998 contributed to the reductions in tobacco prevalence in 1998 to 2017 and to our estimates of the health and economic gains in this period. On the other hand, our estimates exclude the health and economic gains that will occur after 2017 from prevalence reductions prior to 2017. After 2017, we expect the annual benefits of reduced tobacco use during 1998 through 2017 will continue to grow as the people who stopped or never started smoking during the past 20 years age into years that would have been at ever-increasing risk for smoking-attributable disease. The more rapid decline in youth and young adult smoking prevalence seen in figure 1 should reinforce a trend of increasing gains.
Estimates of the economic costs of cigarette smoking have been available for more than 25 years.41 42 Among the more recent estimates, the Centers for Disease Control and Prevention updated their estimates for SAMMEC,10 43 Max et al estimated the economic burden of smoking for California,44 and Maciosek et al estimated per person costs of smoking by age group, sex and smoking status.21 In principle, each of these could be used to compare the economic burden of smoking with different smoking prevalence rates. However, the changes in smoking-attributable medical costs over time are specific to the patterns of change, the mix of current, never and former smokers that underlie smoking prevalence rates, the age distribution of current and former smokers in each year and the distribution of time since quit of former smokers in each year. Our simulation accounts for each of these factors.
Levy et al 11 previously simulated individual tobacco control policies enacted in Minnesota over an 18-year period using the Minnesota SimSmoke model. They found that state tobacco control policies enacted from 1993 to 2011 (including price increases, comprehensive clean indoor air legislation, media campaigns, cessation services through quit lines and increased enforcement of youth access laws) prevented 2897 deaths more than would have been prevented if state tobacco control policies had remained at 1993 levels. Our estimate of 4118 deaths prevented over the 20 years from 1998 to 2017 is in line with that of Levy et al 11 considering that our estimate reflects the effects of all changes in prevalence, including policy impacts on youth initiation in prior years. Levy et al’s11 estimates imply an average of 445 deaths prevented for each one percentage point change in prevalence, while our estimates imply an average of 411 deaths prevented for each percentage point change.
Our method can be broadly applied to other time periods and geographies with similar adaptations of the simulation model. The methods section notes several limitations related to approximations of model parameters to the Minnesota context: we needed to use projected tobacco prevalence trends after the most recently available survey year; we approximated Minnesota-specific disease case rates; the relative risks of smoking attributable disease were based on a nationally representative rather than state-representative population; and we approximated Minnesota per-person smoking-attributable medical costs and productivity impacts by scaling estimates from national samples. For some of these variables, it would be possible to obtain state-specific estimates with an extended study timeline, though it seems unlikely that our results would be materially different. Perhaps more significant, the exponential relationship of time since quit and the smoking-attributable medical costs of former smokers’ medical costs, which the Congressional Budget Office based on a review of the decline in mortality rates,34 may lead to biased estimates of the medical costs savings realised by 2017. In addition, lacking detailed longitudinal relapse data, the relapse curve we constructed from available studies was applied to all quits, regardless of what prompted the quit or the calendar year in which the quit occurred. In sensitivity analysis, we found that systematic error in measurement of key model inputs may create meaningful changes to the estimated impacts. However, even in the improbable scenario of several parameters being simultaneously changed to their least favourable values, medical cost savings and productivity gains remained above $1 billion each.
Our estimates provide insight to the additional harms that might have occurred if they had not been prevented through active tobacco control policy. The evidence for tobacco control policy is well documented.10 45 46 Additional gains are possible in the coming decades through maintaining and expanding evidence-based tobacco control policy. Decisions to make further public investments to reduce youth initiation and to help adult smokers who want to quit will further reduce the harms of tobacco use. By quantifying and making more tangible the invisible impact of having reduced smoking prevalence, the results presented above can help public health advocates communicate the benefits already realised and illustrate the potential of future investments in tobacco control.
What this paper adds
The health and economic burden of cigarette smoking is well documented.
Simulation studies have estimated the potential for tobacco control policies to reduce this burden through future reductions in smoking prevalence.
Studies have not highlighted the population health and economic gains that have already been achieved by reducing tobacco use.
Using a detailed microsimulation model, we estimated the invisible health improvement and economic benefits derived from already-realised reductions in smoking prevalence.
We illustrate these gains using the historical experience of a US state of 5.5 million persons which has achieved a 10 percentage point decline in smoking prevalence over the last 20 years by being at the forefront of tobacco control.
By reporting a broader variety of effects—including smoking prevalence, disease events, deaths, health care expenditures and productivity—than found in other tobacco policy simulations, the results will motivate informed decisions on future tobacco control policy.
References
Footnotes
Contributors ABF and MVM drafted the bulk of the manuscript. BAS and AWS conceived the study. MB, MVM and ZX developed and implemented the analysis plan.All authors critically reviewed the manuscript.
Funding This study was supported by ClearWay Minnesota. Coauthors employed by ClearWay Minnesota (BAS and AWS) conceptualised the study, and participated in interpreting results and revising the manuscript.
Competing interests MVM, ABS, XZ and MB received support for this work through a research contract between their employer and ClearWay Minnesota.
Patient consent for publication Not required.
Provenance and peer review Not commissioned; externally peer reviewed.
Data availability statement Data are available upon reasonable request.