Article Text

Abstract
Objective To evaluate the impact of the dynamic 2007–2010 tobacco tax policy in Ukraine on cigarette prices, cigarette consumption, tobacco tax revenue and the tobacco industry's price strategy.
Methods Using data on cigarette sales, cigarette prices, income and tobacco control policies, price elasticities of cigarette demand in Ukraine were estimated using two methods. Annual data were used to generate point price elasticity estimates, while monthly data were used in a two-step Engle–Granger procedure.
Results The point price elasticity estimate is data sensitive and ranges from −0.11 to −0.62, centring around −0.32. The regression model estimates a long-run price elasticity of −0.28. Cigarette consumption fell by 13% in 2009 and 15% in 2010 while the tax revenue increased by US$700 million and by US$500 million in 2009 and 2010, respectively, compared to the previous year. Tax increases have changed the tobacco industry's price strategy from one of shielding consumers from the impact of smaller tax hikes in 2007–2008, to one of increasing industry net-of-tax prices, after recent, larger tax increases.
Conclusions The higher real tobacco excise taxes of 2009 and 2010 have significantly reduced tobacco consumption in Ukraine, resulting in encouraging public health and fiscal gains. It will be important for cigarette prices/taxes to keep pace with inflation and income growth for this impact to be sustained.
- Ukraine
- price elasticity of cigarette demand
- tobacco tax
- economics
- prevalence
- taxation and price
Statistics from Altmetric.com
Introduction
Smoking prevalence in Ukraine, as in other former Soviet Union republics, is high. More than 66% of adult men used tobacco in 2005,1 primarily in the form of cigarettes. The smoking prevalence among women is lower, but it has increased since the collapse of the Soviet Union in the early 1990s, reaching about 20% in 2005.1 The prevalence of smoking among younger to middle-aged women reached about 32% in the same year.1 Tobacco use is to blame for at least 115 000 tobacco-related premature deaths per year,2 contributes to declining male and stagnant female life expectancy,3 and burdens the economy with high healthcare costs and lower labour productivity. The productivity loss due to premature smoking-related mortality alone is estimated to be at least 15.6 billion Ukrainian Hryvnia (UAH) (US$3 billion) annually.2
The entry of transnational tobacco companies into Ukraine in the early 1990s and the privatisation of the tobacco industry have dramatically changed the nature of the cigarette market from a state monopoly with limited brand choices and unattractive packaging to a competitive market with fully developed advertising/promotion campaigns and a wide variety of brands. Cigarette production, which declined sharply with the collapse of the Soviet Union, recovered shortly after privatisation and eventually exceeded Soviet-era production levels by 59% in 2008.
The government of Ukraine began to formulate tobacco control policies in late 2005 by adopting legislation that called for annual increases in tobacco excise taxes; bans on tobacco advertising, promotion and sponsorship; a ban on smoking in workplaces and public places; and organising prevention and cessation programmes.4 ,5 Ukraine ratified the WHO Framework Convention on Tobacco Control (FCTC) in 2006. As of 2010, however, the majority of the tobacco control law provisions, with the exception of tax policy, have not yet been fully implemented or enforced.
Between January 2005 and August 2008 the government of Ukraine increased excise taxes on cigarettes four times, primarily for fiscal reasons (table 1). This policy resulted in only modest cigarette price increases that did not even keep pace with inflation, and was the result of a successful tobacco industry lobbying effort.7 ,8 ,9 Rising disposable income during this period increased the affordability of cigarettes.10 Consequently, cigarette sales increased by 17% between January 2005 and August 2008. Simultanelously, government revenue from tobacco taxes has been steadily rising; annual cigarette tax revenue went up by 97% (28% in real terms) from 2005 to 2008.
Tax rates for domestic filtered cigarettes
Seeing the revenue potential of tobacco tax, the Ukrainian parliament approved multiple tax increases in response to a government budget crisis: a 114% specific tax increase and an ad valorem tax increase of about one‐third in September 2008, a 25% specific tax increase in February 2009, and a 60% specific tax increase in May 2009, accompanied by doubling of the ad valorem tobacco tax rate. Cigarette excise taxes were further increased in January 2010 (15% specific and 25% ad valorem tax increase) and in July 2010 (30% specific tax increase) (table 1). How these unprecedented tobacco tax increases in a relatively short period of time have impacted smoking behaviour is of interest to the research community and policy makers.
The price elasticity of cigarette demand, a measure of market sensitivity to price changes, is the key element in predicting the impact of a tax policy. Few estimates of cigarette price elasticity exist in Ukraine. Three studies using micro-level survey data suggest that it ranges from −0.30 to −0.49 (Ukraine via Economic Tools, unpublished report, 2004).11–13 However, these studies did not address the potential endogeneity of the price measure, which can bias the estimates. One study using macro-level data found no impact of cigarette prices on cigarette sales, but suggested that affordability (cigarette prices relative to average income) rather than cigarette prices alone has a significant effect on cigarette sales.14 Thus, the magnitude of consumer response to changes in cigarette prices in Ukraine is unclear.
In this paper we evaluate the impact of the 2007–2010 tobacco tax policy changes in Ukraine on cigarette prices, cigarette consumption and tobacco tax revenue, as well as on tobacco industry price strategy. Using macro-level data, we estimate the price elasticity of cigarette demand.
Methods
We used two methods to study the quantitative impact of tax/price changes on cigarette consumption in Ukraine: an econometric model employing monthly consuption data, and a point price elasticity calculation using annual data on consumption.
We focused on filtered cigarettes, as they constituted about 93% of total cigarette sales in 2009 and 2010,15 and used three measures of their consumption. We start our time series in 2007 since previous records are available only on a yearly basis. The data and the variables employed in the analyses are summarised in table 2.
Summary statistics: variables included in each analysis
In addition to the three measures of annual cigarette consumption, we tried to estimate the consumption of filtered cigarettes by dividing tobacco excise tax revenue by the average excise tax per pack. However, this method is less suitable for Ukraine due to the excise tax structure (the amount of the excise tax collected varies with the brand choice), and because tax revenue is reported for filtered and unfiltered cigarettes together. In addition, tax revenue in Ukraine lags behind cigarette sales by at least 1 month and is also affected by wholesaler stockpiling.
The monthly cigarette sale data fluctuate considerably over time. For example, cigarette sales usually go up a month before a tax increase and drop in the following month as the result of stockpiling. Stockpiling became apparent in the data only after the excise taxes began to increase considerably in later 2008 through 2010. Cigarette sales may also follow seasonal trends (figure 1).
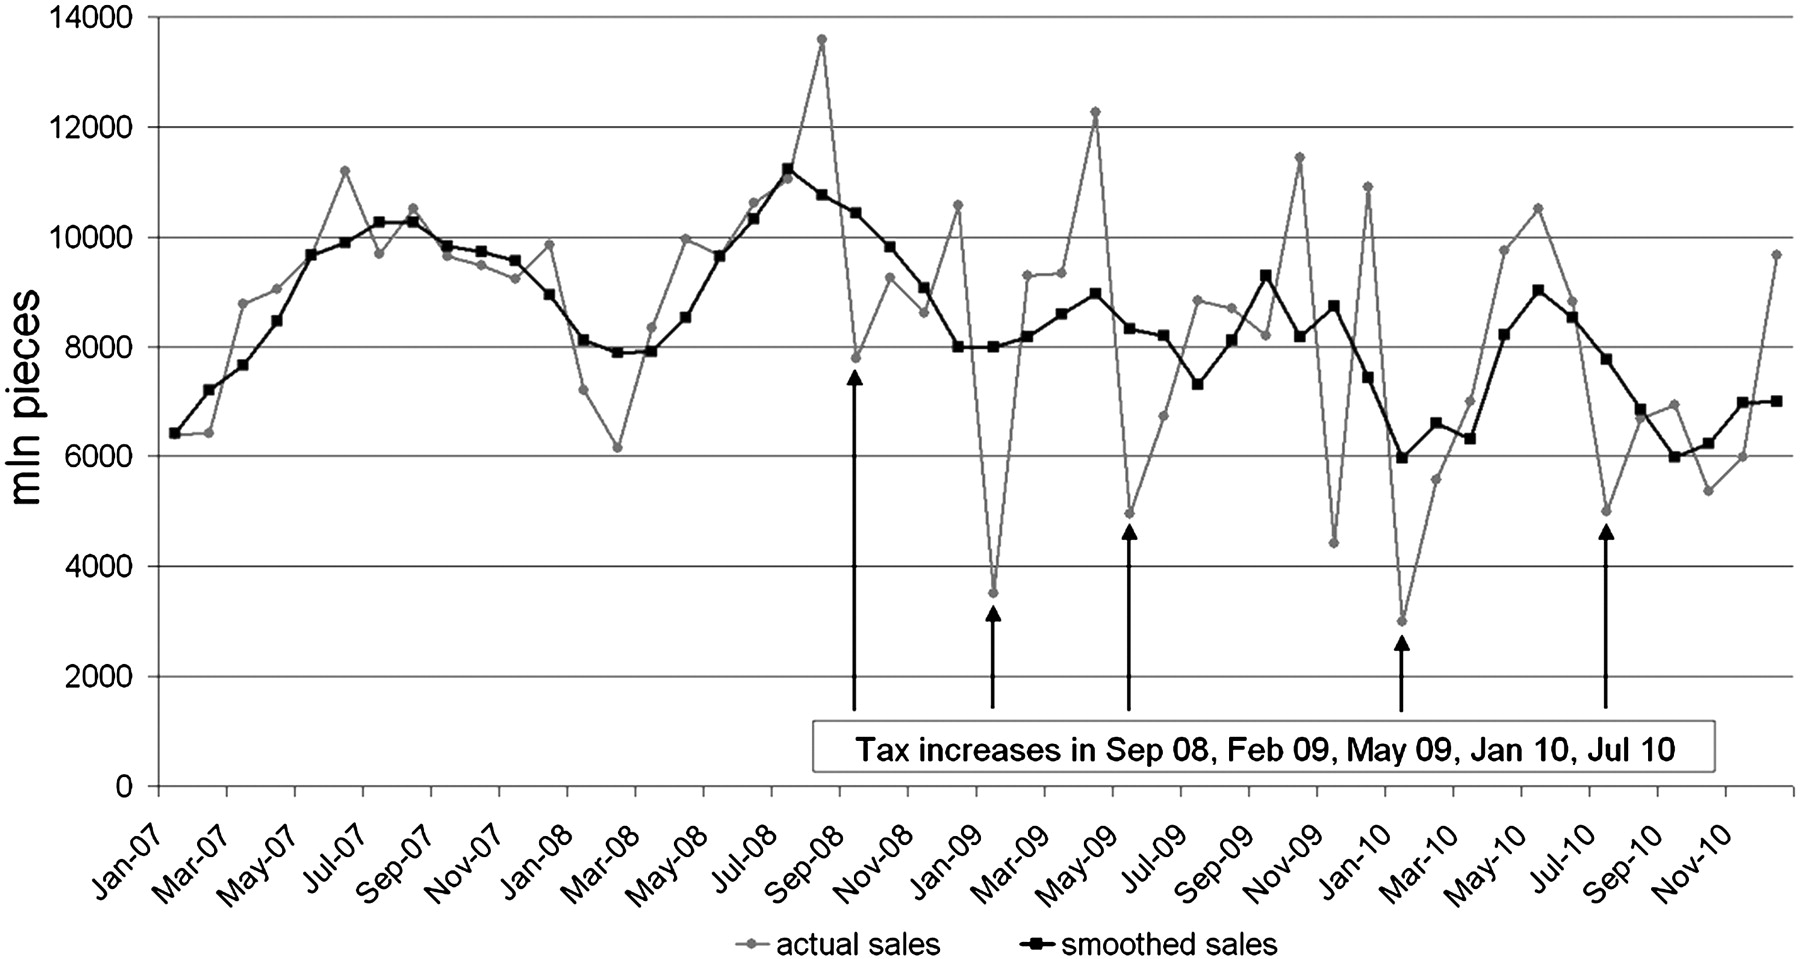
Sale of filtered domestic cigarettes in Ukraine. The sales fluctuation around the February 2009 tax increase is an outlier, because the tax was expected to increase in January 2009 as it had every January between 2004 and 2008 (with the exception of 2006). Fluctuation around November 2009 was caused by an expected tax increase that was adopted by the Ukrainian parliament in October 2009, but later vetoed by the President.
In an attempt to smooth the data and determine a trend, we used a moving average filter with a span of 4 months (figure 1).
Our measure of consumption might be affected by the fact that a large share of the domestic tax paid cigarette sales is illegally exported abroad, primarily to the European Union (EU).5 WHO and the Ukrainian Ministry of Health estimate that about 30 billion cigarettes (about every fourth cigarette produced in Ukraine) were smuggled abroad in 2005.5 Ukraine was identified as the most frequent source of contraband cigarettes in the European region in 2009,17 with Poland and Hungary being the largest destination markets.5
It is possible that the 2008–2010 cigarette tax increases in Ukraine and tighter border control with its Western neighbours (Poland, Slovakia and Hungary, who became part of the EU Schengen Area with no internal border controls in late 2007) led to a decline in cigarette smuggling from Ukraine.
However, the cigarette price differences between Ukraine and its EU neighbours (Poland, Hungary, Slovakia and Romania) grew from 2007 to 201015 ,18 due to strong depreciation of the Ukrainian Hryvnia against other European currencies, which made goods produced in Ukraine more affordable abroad, and due to increasing tobacco taxes in the EU, particularly among the new EU member states bordering Ukraine.18 This growing price difference can stimulate illicit cigarette trade.19–21
The illegal nature of cigarette smuggling results in very little publicly available data, preventing us from estimating the 2007–2010 changes in illicit cigarette trade in Ukraine. We found that the number of cases where illegal export of cigarettes was stopped by Ukrainian customs rose by nearly 50% between 2007 and 2010.22 This could indicate that more illegal cigarette trade is occuring, but also better law enforcement is at work. However, the number of illegal cigarettes confiscated in Poland, the vast majority of which come from Ukraine,23 dropped from 2009 to 2010.24 This could signal reduced illegal cigarette exports from Ukraine or that smugglers found other routes.25
There are also illicit cigarettes on the Ukrainian market, mainly from Russia and Moldova,26 but they represented only a negligible share of the cigarette market that, despite substantial tobacco tax increases, amounted to only 1.5% in 2010.26–28
The literature suggests that changes in tobacco taxes and prices alone do not fully explain the level of illicit cigarette trade and that factors other than tax, such as the level of corruption, social tolerance for illegal activities, the presence of informal distribution networks, etc., are also important determinants of illegal cigarette trade (Ukraine via Economic Tools, unpublished report, 2004).29 None of these factors changed dramatically in Ukraine from 2007 to 2010.
Due to our inability to assess changes in the illicit cigarette trade in Ukraine from 2007 to 2010, we assumed that these changes were minimal and we attribute all changes in cigarette sales to changes in consumption.
The explanatory variables in our models are cigarette prices and income, and in the regression model, other tobacco control measures (table 2). The average price of filtered cigarettes, combined with the tax rate, allowed us to calculate the average industry price, which consists of costs, manufacturer profit margins and retailer profit margins; it is an important indicator of the industry's pricing strategy. Tobacco control measures are summarised by an index in order to preserve the degree of freedom in the analysis. The index is a sum of four dichotomous indicators, capturing an anti-tobacco advertising campaign on TV and billboards in December 2008 to May 2009 in three major cities, higher fines for non-compliance with clean indoor air laws in cafés and restaurants since July 2009, a ban on outdoor advertising since January 2009, and a ban on tobacco adverts in print media since January 2010.5
Regression model
We used the following conventional model and linear functional form:
We subjected our model to a variety of tests and found that price is exogenous (Hausman's test), the variables are stationary in their first differences (based on the Dickey–Fuller test for unit root), and that the variables are cointegrated (Engle–Granger test and Johansen's test). Therefore, we proceeded with the analysis confident that our regression results would not be biased.
The regression model employs an Engle–Granger two-step approach.30 In the first step we estimate the long-run equilibrium using ordinary least squares (OLS) (equation 1). The second step uses an error correction model (ECM). It is based on the notion that deviations from long-run equilibrium tend to partially revert in the following period. The ECM uses stationary data and includes lagged residuals from the long-run relationship. We have also included a lagged dependent variable to address autocorrelation detected in the ECM model (equation 2).
Point price elasticity
The point price elasticity of cigarette demand is calculated by dividing the percentage change in consumption between 2007 and 2008, 2008 and 2009, and 2009 and 2010 by the percentage change in real cigarette prices for the corresponding period (equation 3), while accounting for the income effect (equations 4 and 5).
We employed three different estimates of the income elasticity of cigarette demand in Ukraine in equation 5. One is from an unpublished study that estimated an income elasticity of +0.06, using cross-sectional micro-level data representing all regions of Ukraine (2700 observations) and an OLS model with price and income as explanatory variables controlling for sex, age and other sociodemographic characteristics of the population.12 The second estimate of +0.29 is from a published article where the authors used monthly time series data from 1997 to 2006 and an OLS model with a first-order autoregressive (AR(1)) process to investigate the impact of cigarette price/tax, household income, the affordability of cigarettes and the volume of tobacco advertising on Ukrainian domestic cigarette sales, while controlling for other factors.14 The last estimate is a result of our regression model.
The limitation of this approach is that, unlike the econometric model, this method does not allow us to control for other tobacco control measures. To the extent that these measures reduce consumption, the estimates based on this method would be upwardly biased.
Results
Table 3 summarises nominal and real (inflation adjusted) values of cigarette retail prices, taxes and industry prices.
Cigarette prices and taxes in Ukraine (in Ukrainian Hryvnia (UAH)), 2007–2010
Two small tobacco tax increases between January 2007 and August 2008 raised the total cigarette tax (excise plus VAT) by 22% in nominal terms, but it was not enough to keep pace with inflation. This changed as of the second half of 2008: between August 2008 and December 2010, the cigarette tax increased by 405% in nominal terms while inflation stayed at 31% during the same period.
Retail cigarette prices have responded to the tax policy, but to varying degrees. The first wave of tax changes (January 2007–August 2008) increased the average price of filtered cigarettes by 14% nominally (a 14% drop in real terms), but the tax increases after August 2008 led to substantial increases in real cigarette prices; they jumped by 126% from August 2008 to December 2010 (table 3).
Cigarette tax policy influenced the price strategy of the tobacco companies. Between January 2007 and January 2008, the real cigarette excise tax rose by 6%, yet real cigarette prices and real prices before tax fell by 11% and 17%, respectively, during the same period. It seems that the tobacco industry was able to protect consumers from the tax increases and general inflation when taxes represented a relatively small share of the retail price.
In 2009, after major tax hikes, the tobacco industry changed its strategy: it stopped shielding its customers from inflation, passed new taxes on to consumers and even raised its own prices in order to increase profit margin. From January 2009 to December 2010 the industry price rose by 65% in nominal terms and 39% in real terms (figure 2).

Share of taxes in real filtered cigarette prices in Ukraine. The base for the inflation adjustment is January 2007. The short-term drops in the industry price are related to stockpiling that allows the industry to sell cigarettes at pre-tax-increase levels for at least a month after the tax increase.
Since the end of 2008, cigarette price/tax increases were accompanied by declining filtered cigarette sales: a 13% drop in 2009 and 15% drop in 2010. The negative impact of cigarette prices on cigarette sale was confirmed by our regression model (tables 4 and 5).
Long-run equilibrium, ordinary least squares (OLS), dependent variable: Qt (trend adjusted monthly sales of domestic filtered cigarettes)
Short run error correction model, dependent variable: ΔQt(Qt–Qt–1)
Price and income both had significant impacts on cigarette consumption in Ukraine in the long run, with price elasticity of −0.28 and income elasticity of +0.24 (both calculated at means) (table 4). Other tobacco control measures had a significant negative impact on cigarette consumption.
Non-price tobacco control measures also reduce cigarette consumption in the short run, but the price and income coefficients are not significant, meaning that within the first month cigarette sales will not respond to changes in prices and incomes. This was expected as it can take some time for consumers to adjust to the new market conditions, given the addictive nature of cigarettes. The coefficient of the residual from the long-run equation indicates that about 44% of the deviation from the long-run equilibrium will adjust in the subsequent period.
The point price elasticity estimates using three income elasticity estimates and three measures of consumption are summarised in table 6. The estimates range from −0.11 to –0.34 for the 2007–2008 period, from –0.14 to −0.24 for the 2008–2009 period and from –0.49 to −0.62 for the 2009–2010 period. The simple average 2007–2008, 2008–2009 and 2009–2010 price elasticities are −0.20, −0.18 and −0.57, respectively.
Point price elasticity estimates
Changes in tobacco tax and industry price have led to higher tobacco tax revenues despite falling consumption: an additional UAH1.1 billion (US$0.2 billion) in 2008, UAH5.5 billion (US$0.7 billion) more in 2009 and UAH4 billion (US$0.5 billion) more in 2010, all compared to the previous year. Total excise tax revenue on filtered cigarettes amounted to more than UAH13 billion (US$1.6 billion) in 2010, a sum equal to nearly 2% of Ukrainian GDP.
Discussion
We found a significant negative relationship between cigarette price and cigarette consumption in Ukraine. The long-run price elasticity of cigarette demand based on our regression model is −0.28, meaning that a 10% increase in real cigarette price will decrease the demand by 2.8%. The impact of price on cigarette consumption in the short run is not statistically significant, possibly due to stockpiling, tobacco industry price strategy, and the addictive nature of smoking that usually requires a smoker to make several attempts before he/she can quit. The point price elasticity results also indicate that the response to cigarette prices was stronger in 2010 after 2 years of price increases, compared to 2009.
The relatively low price responsiveness of cigarette demand in Ukraine might be the result of the wide range of cigarette prices available on the market and/or the high social acceptability of smoking. In addition, sales data provide evidence of stockpiling of cigarettes before a tax increase. This behaviour may weaken the impact of tax increases by allowing smokers to gradually adjust to higher cigarette prices. Other studies from former Soviet republics also suggest that the price elasticity of cigarette demand in this region might be low.31 ,32
Our estimate of the income elasticity of cigarette demand is close to the one calculated by Peng and Ross.14
Analysing the price strategy of the tobacco industry, we found that smaller tax increases in 2007 and early 2008 were to some extent absorbed by the industry, making the tax increases ineffective in terms of their public health impact. Since salaries in Ukraine rose by 6% in real terms during that time, the affordability of cigarettes increased, leading to higher cigarette consumption.
The larger 2008–2010 tobacco tax increases made the tobacco industry rethink its pricing strategy: tobacco manufacturers raised their own prices in order to maintain profit in the face of falling consumption,33 and cigarette prices went up more than they would have due to the excise tax increases alone.
The 2009–2010 tax policy in Ukraine that led to increasing real cigarette prices has been accompanied by declining smoking prevalence. The State Statistics Committee reported a decline in adult smoking prevalence from 27.5% in 2008 to 25.5% in 2009 (a 7.27% drop).15 A national representative survey shows a decline in adult smoking prevalence from 27.0% in May 2009 to 24.8% in October 2009 (an 8.15% drop).34 Following a simulation model developed by Ross et al2 and employing 2008–2010 annual data, we estimate that due to cigarette price changes there were about 1.02 million fewer smokers (depending on the price elasticity, this could range from 0.74 to 1.39 million) and 1.67 million fewer smokers (depending on the price elasticity, this could range from 1.45 to 1.86 million) in 2009 and 2010, respectively, compared to the previous year. Hence, the 2008–2010 tobacco tax increases led to a significant increase in government revenue and to an improvement in public health. The number of smokers was reduced by 2.7 million by preventing smoking initiation and increased cessation among current smokers.
Our methodology has several limitations. We focused only on filtered cigarettes, but the presence of non-filtered cigarettes and other tobacco products in the market provides an opportunity to respond to a tax increase by switching to these other products, thereby reducing the public health impact of tobacco taxation. This happened to some extent in Ukraine when the sales of non-filtered cigarettes went up by 17% while sales of filtered cigarettes dropped by 13% after the first large tax increase in 2008. In 2010, however, the sales of non-filtered cigarettes dropped by 12% after their excise tax went up sharply. At the end of 2010, the sales of non-filtered cigarettes constituted only 7% of total cigarette sales in Ukraine.
Our models do not control for changes in illicit trade in cigarettes, due to the lack of data and the possibility that these changes can be in either direction in the time period under consideration. An inability to control for illicit trade is a major limitation of our study.
Despite the sizeable tobacco tax increases in recent years, Ukraine has room for further tobacco tax increases, since the rate is still far below the rate applied within the EU that Ukraine aspires to join. Ukrainian politicians seem to understand that, since they enacted another tobacco tax increase in January 2011.
It is crucial for the tax rate to keep pace with inflation and income growth so that the affordability of cigarettes stays constant or decreases. A focus on the specific tobacco excise could be particularly effective in reducing the substitution between different cigarette brands. Comparable tax increases should be adopted for other tobacco products in order to reduce their consumption, limit opportunities for product substitution and generate additional tax revenue.
What this paper adds
While numerous studies have investigated the economic and public health impact of cigarette taxes in high-income countries, evidence from low-income and lower-middle-income countries is scarce, and only a few studies cover the former Soviet Republics.
We estimate the price elasticity of cigarette demand in Ukraine and demonstrate the impact of the large 2007–2010 excise tax increases on tax revenue, public health and the tobacco industry's price strategy.
Acknowledgments
We gratefully acknowledge the help of Hanna Hopko for providing information on tobacco control policies in Ukraine, and Alex Liber for editing assistance.
Footnotes
Competing interests None.
Provenance and peer review Not commissioned; externally peer reviewed.