Article Text

Abstract
Objective To measure levels of fine particulate matter in the rear passenger area of cars where smoking does and does not take place during typical real-life car journeys.
Methods Fine particulate matter (PM2.5) was used as a marker of secondhand smoke and was measured and logged every minute of each car journey undertaken by smoking and non-smoking study participants. The monitoring instrument was located at breathing zone height in the rear seating area of each car. Participants were asked to carry out their normal driving and smoking behaviours over a 3-day period.
Results 17 subjects (14 smokers) completed a total of 104 journeys (63 smoking journeys). Journeys averaged 27 min (range 5–70 min). PM2.5 levels averaged 85 and 7.4 μg/m3 during smoking and non-smoking car journeys, respectively. During smoking journeys, peak PM2.5 concentrations averaged 385 μg/m3, with one journey measuring over 880 μg/m3. PM2.5 concentrations were strongly linked to rate of smoking (cigarettes per minute). Use of forced ventilation and opening of car windows were very common during smoking journeys, but PM2.5 concentrations were still found to exceed WHO indoor air quality guidance (25 μg/m3) at some point in the measurement period during all smoking journeys.
Conclusions PM2.5 concentrations in cars where smoking takes place are high and greatly exceed international indoor air quality guidance values. Children exposed to these levels of fine particulate are likely to suffer ill-health effects. There are increasing numbers of countries legislating against smoking in cars and such measures may be appropriate to prevent the exposure of children to these high levels of secondhand smoke.
- Environmental tobacco smoke
- vehicles
- public health
- legislation
- exposure assessment
- secondhand smoke
Statistics from Altmetric.com
Introduction
Exposure to secondhand tobacco smoke (SHS) is associated with a range of child health issues including sudden infant death, lower respiratory infection, middle ear disease, wheeze, asthma and meningitis.1 Children are likely to be at greater risk from SHS exposure due to their faster breathing rates, less developed immune system and their inability to move away from the source in many home and car settings. Smoke-free legislation has led to significant changes in exposure to SHS in work settings and public places, including bars2 and restaurants, with no obvious displacement effect to homes3 at a population level. The recent Royal College of Physician Tobacco Advisory group report ‘passive smoking and children’ called on regulation to prohibit smoking in vehicles as part of a wider campaign to both reduce smoking prevalence and non-smokers' exposure to SHS.1 There is substantial support for restrictions on smoking in cars, particularly cars carrying children4 ,5 with some national- and state-level laws already in force in Canada, USA, Australia, Cyprus and South Africa.6 In the UK, there has recently been a parliamentary debate calling on legislation to ban smoking in cars containing children,7 while the First Minister of the Welsh Government has indicated that Wales may consider introducing legislation on this matter.8 In November 2011, the British Medical Association (BMA) called on legislation to prohibit smoking during all car journeys in the UK.9
Measurement of the airborne mass of fine particulate matter that measures <2.5 μm in diameter (PM2.5) is a well-established marker for SHS concentrations with previous studies demonstrating high PM2.5 levels in indoor environments such as bars where smoking takes place.2 Data from the USA,10 ,11 Canada12 and New Zealand13 have also reported high levels of PM2.5 in cars of smokers. One recent study14 carried out in the UK published details of 21 car journeys and associated measurements of PM2.5. This study indicated time-weighted average (TWA) concentrations of PM2.5 between 13 and 242 μg/m3 (mean 88 μg/m3) during the 15 car journeys where smoking took place. For comparison, the US Environmental Protection Agency has a health-based guidance level for outdoor PM2.5 concentrations of 35 μg/m3 averaged over a 24 h period,15 while WHO last year indicated that their PM2.5 air quality guidance value of 25 μg/m3 can now be applied to indoor environments.16
Previous studies quantifying exposure to SHS in cars have tended to be simulations where participants have been specifically asked to smoke in order to provide a smoky in-car environment to measure.10–13 Clearly, these simulations and controlled experimental conditions may influence the exposure concentrations measured, and there is a need to generate real-life data on SHS concentrations measured in cars during normal smoking and driving activity. This study aimed to assess SHS levels in a range of cars owned by a variety of smoking owners with measurements being collected across 3 days of typical journey activity.
Methods
Recruitment and ethics
This study was carried out in two locations. The NHS Greater Glasgow and Clyde Study was carried out across various locations in the West of Scotland between 4th and 14th October (autumn) 2010. The NHS Great Yarmouth and Waveney (NHS GY&W) Study took place between 7th and 18th March (spring) 2011 and occurred within and around Great Yarmouth and Lowestoft in the East of England. Participants from both areas were recruited from a convenience sample through local contacts of the NHS Tobacco Control Teams in each area. A study information sheet was provided, and written informed consent was gained from each participant.
Participants were asked to undertake their normal driving and smoking behaviours and not to alter how they typically behaved over the 3 days when the measurement device was placed within their vehicle. Participants were requested not to carry children during the smoking journeys and to comply with any policy relating to smoking and driving at their workplace.
In both locations, the local NHS contacts held discussions with their local ethics committee and received confirmation that formal ethical approval was not required for this observational study.
Measurement
The research design and study tools were broadly similar to those used in a previous UK study involving one of the authors (KSG).14
PM2.5 was measured during each car journey using a Sidepak AM510 Personal Aerosol Monitor (TSI Inc., Shoreview, Minnesota, USA), a device that has been extensively used in the research and measurement of SHS concentrations. For the Glasgow Study, recruits were asked to place a child-sized doll within a front-facing car seat in the rear car seat directly behind the front passenger seat of their car during all journeys they made over a 3-day period. A short length of tubing attached the monitor to the nose/mouth area of the doll. A similar method, however, without the doll and car seat, was used in the GY&W Study. Here, the monitor was attached to the rear seat belt at shoulder height—a level likely to be similar to the breathing zone of a rear-seated child.
Participants were provided with a detailed instruction sheet and were given a demonstration by one of the study authors (AA) on how to set the SidePak device to logging mode at the start of each of their car journeys and how to switch off the instrument at the end. A questionnaire was administered at the beginning of their participation in the study to gather basic demographic details. Participants were also supplied with 10 one-page data collection sheets, which were used after each journey to collect simple information on journey duration, miles travelled, number of cigarettes smoked, window opening and use of ventilation.
The Sidepak AM510 devices had a PM2.5 impactor attached and had been internally calibrated against recently serviced and calibrated devices. A calibration factor of 0.295 to correct for the density of SHS-based aerosol was applied as described elsewhere.17
PM2.5 measurements were logged at 1 min intervals over each car journey, with each 1 min data point being the average of sixty 1 s sample measurements. On completion of the 3-day sampling period the device was retrieved and the data were downloaded using Trackpro 4.1.0.1 software. Data were then transferred to the Microsoft Excel package for analysis.
The Sidepak device was cleaned, the impactor re-greased and the instrument zero-calibrated before being passed to the next study participant.
Statistical analysis
The average and maximum PM2.5 concentrations were calculated for each car journey. The percentage of time when the PM2.5 concentration exceeded a value of 25 μg/m3 (WHO guidance level for indoor air) was calculated for each journey. Data from each participant questionnaire and from each journey collection sheet were then entered into an Excel worksheet and matched up with the Sidepak-derived PM2.5 exposure data for each journey.
Descriptive statistics and analysis of the data were done using GenStat V.11 (VSN International), and plots of the average and maximum PM2.5 levels by journey characteristic were performed using SigmaPlot V.10 (Systat Software Inc.). As is typical for exposure-type data, the PM2.5 data were skewed. Taking logs of the data resulted in it being approximately normally distributed so all subsequent statistical analysis was carried out on the log scale.
A t test was carried out to investigate the difference between the levels during smoking and non-smoking journeys, where a test for equal variances determined whether to pool the variances or estimate them separately. Regression analyses were used to examine whether ventilation had an effect on the PM2.5 levels. This was done for the whole sample, as well as for the smoking journeys alone.
The effect of ventilation conditions during the journey was explored by comparing different combinations of window positioning and ventilation settings. Journey ventilation conditions were classified as: (1) low if windows closed most/all journey and ventilation off for most/all journey, (2) medium if windows closed most/all journey and ventilation on for most/all journey and (3) high if windows open for most/all of the journey.
Results
Study participant characteristics
Seventeen drivers participated in the project (eight from the Glasgow and nine from the GY&W studies). In total, 14 smokers (six males and eight females) and three non-smokers (one male and two females) were recruited. Five of the smokers reported smoking 20 or more cigarettes per day, seven smoked between 10 and 19 cigarettes per day, while two reported smoking <10 cigarettes per day. All but one of the smokers indicated that they generally smoked several times a day inside the car. The average age of the 16 participants who provided details of their age was 48 years, ranging from 24 to 68. Seventeen cars were used with most of these classifiable as small to medium family sized cars. Cars ranged in age from <1 year since first registration to 27 years old.
Journey characteristics
The study involved a total of 104 car journeys between the two centres (48 in Glasgow and 56 in GY&W). Two non-smoking journeys where PM2.5 data were collected were excluded from the analysis due to use of early morning de-icing aerosol producing non-combustion-related particulate increases during the beginning of the journey. This left 102 journeys for analysis—63 were smoking journeys and 39 non-smoking journeys. Each participant drove between three and nine journeys with an average of six journeys. The Sidepak device captured PM2.5 data in 83 of the 102 journeys with 14 smoking journeys and five non-smoking journeys not logged due to operator error. Of the 83 journeys for which PM2.5 data could be analysed, 49 were smoking and 34 non-smoking journeys. Twelve of the non-smoking journeys were carried out by the non-smoking participants, with the other 22 non-smoking journeys driven by the smoking participants. Journey start and stop times were taken directly from the Sidepak where these data were available and from the self-report on the journey data collection sheets in the 19 cases where they were not.
Table 1 provides details of the time of day, duration, distance, window positioning and ventilation system use for both smoking and non-smoking journeys. Journeys where smoking took place were much more likely to have windows open for the majority of the journey time (92%) compared with non-smoking journeys (21%) (p<0.001). Ventilation (either car fan or air-conditioning system) was used equally in non-smoking and smoking journeys (62% vs 55%) (p=0.50).
Descriptive summary of time of day, duration, distance, windows positioning and ventilation conditions in smoking and non-smoking journeys
Cigarettes smoked
Examining the 83 journeys with valid PM2.5 data, the number of cigarettes smoked during the journeys ranged from none to four, with no smoking taking place for 34 of the journeys. Only one cigarette was smoked for the majority of smoking journeys (n=33), with the number of journeys where 2, 3 and 4 cigarettes were smoked was 8, 6 and 2, respectively.
PM2.5 concentrations
Table 2 presents the descriptive statistics of the mean and maximum PM2.5 found during smoking and non-smoking journeys, while figure 1 shows the TWA PM2.5 for each journey, by participant. PM2.5 concentrations in three of the non-smoking journeys exceeded the 25 μg/m3 WHO guidance level for indoor air,16 while this occurred in all smoking journeys for between 11% and 100% of the journey time (53% of the time, on average). There was a significant difference in the levels of PM2.5 between smoking and non-smoking journeys (p<0.001).
Descriptive statistics of the mean and maximum PM2.5 concentrations found during smoking and non-smoking car journeys
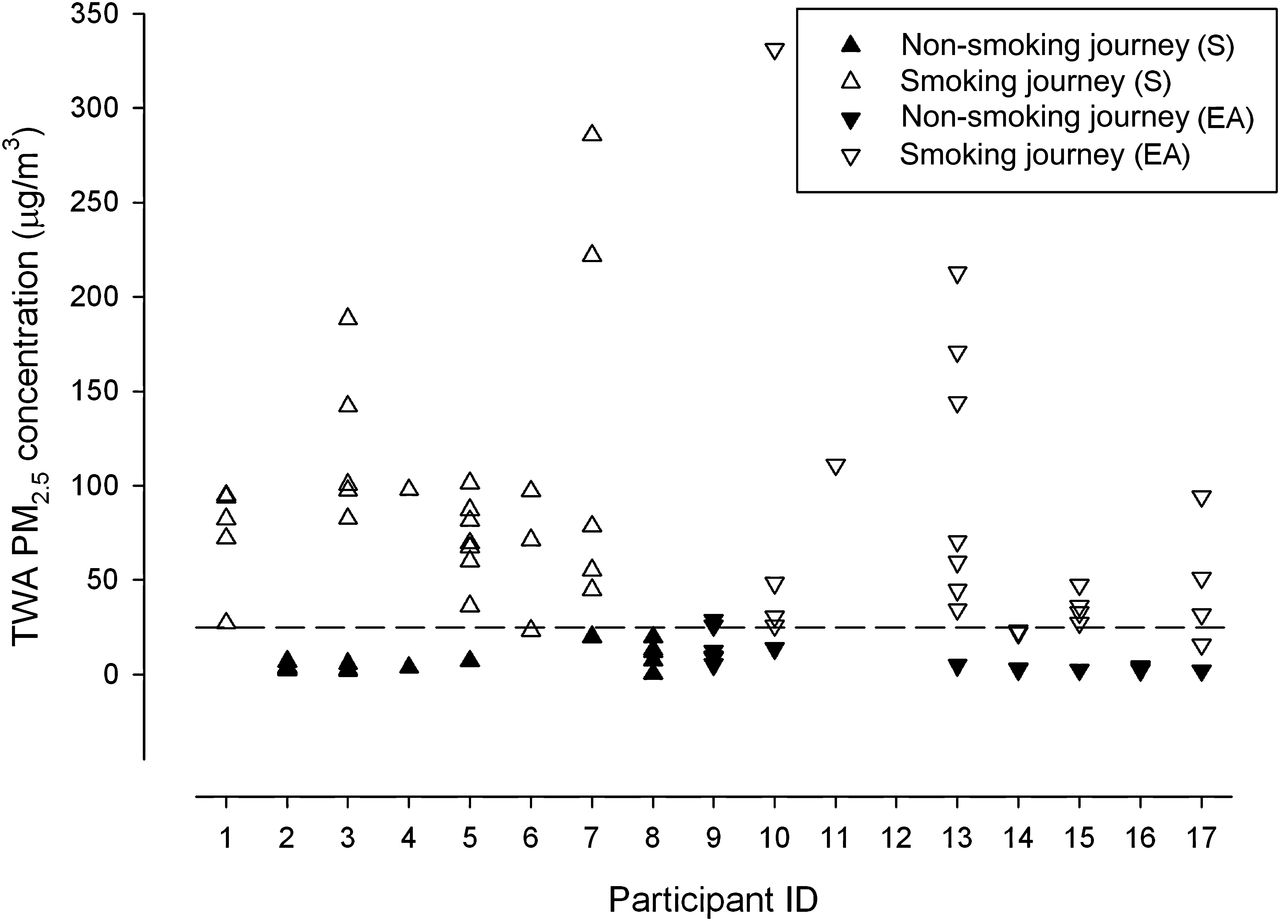
Average concentration of PM2.5 found in car journeys by participant shown separately for smoking (unfilled) and non-smoking (filled) journeys. Glasgow—upward facing triangles (▲) and Great Yarmouth—downward triangles (▼). The dashed line indicates WHO guidance level for PM2.5 at 25 μg/m3.
Figure 2 shows a scatter plot of the log-transformed PM2.5 concentrations against the number of cigarettes per minute for each journey. There was a clear trend for higher PM2.5 concentrations with increasing number of cigarettes smoked per minute. Some 50% of the variance in the log-transformed PM2.5 concentrations was explained by the rate of cigarettes smoked in the car.

Scatter plot of log-transformed PM2.5 concentration against number of cigarettes smoked per minute in the vehicle.
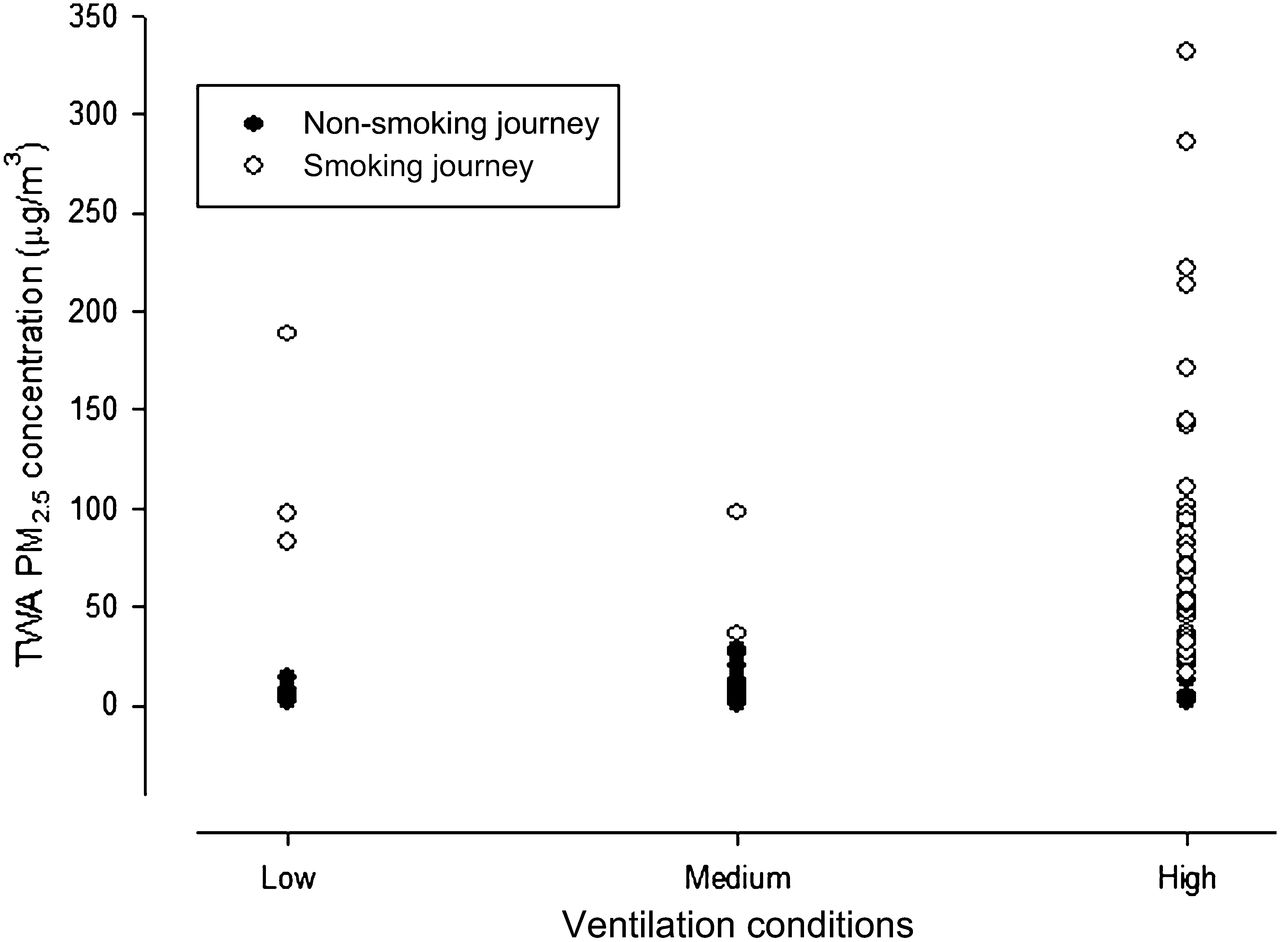
Figure 3 presents the average PM2.5 concentration for each journey categorised by ventilation conditions. It is clear that even in ‘high’ ventilation conditions, the average PM2.5 concentrations during smoking journeys exceed guidance values for fine particulate.

Average concentration of PM2.5 found in car journeys by ventilation conditions. Low: windows closed most/all and ventilation off most/all journey, medium: windows closed most/all and ventilation on most/all journey and high: windows open most/all and any ventilation condition.
Discussion
This study investigated PM2.5 concentrations as a readily measurable key component of SHS levels during car journeys where drivers did and did not smoke. The arithmetic mean PM2.5 concentrations found in cars with active smoking was 85 μg/m3 which is more than three times that of WHO 24 h guidance value of 25 μg/m3.16 The average of the 1 min maximum or peak level measured during the smoking journeys was 385 μg/m3. These values can be compared with those reported in two smaller studies that used very similar methodology. Sanchez-Jimenez et al 14 in the UK and Edwards et al 13 in New Zealand reported PM2.5 concentrations in the rear of cars with the sampling point at the position of a child's nose. The UK study14 reported an arithmetic mean concentration of 88 μg/m3 (range of 13–242 μg/m3), while the New Zealand study13 found a PM2.5 concentration of 168 μg/m3 with the car window fully open.
A number of other simulation studies have investigated PM2.5 concentrations due to SHS in vehicles. Rees and Connolly11 found mean concentrations of 272 μg/m3 when windows were closed and average values of 51 μg/m3 with open windows. A study carried out in Canada under experimental conditions12 measured substantially higher PM2.5 concentrations of 844 μg/m3 in cars with air conditioning on and 223 μg/m3 in situations where the driver was holding the cigarette close to an open window. Both of these studies only measured concentrations during the time when smoking took place, whereas our data relate to typical real-life journeys, which involved a mixture of non-smoking and smoking time periods.
Data presented in our figure 2 illustrate a strong relationship between the concentration of PM2.5 and smoking activity expressed as cigarettes smoked per minute. This would suggest that journeys with several adults smoking several cigarettes over the duration of the journey would lead to very high SHS levels as has been demonstrated in other simulation or controlled experimental conditions.11
Simulation studies carried out by Ott et al 10 found that ventilation, air conditioning, window position and car speed all influenced SHS concentrations in cars. Such factors combined with different participant smoking behaviours as well as differences in study design may account for the variability in PM2.5 concentration across studies.
By design, vehicle ventilation has numerous combinations and permutations making it difficult to assess the air exchange rate in self-described conditions of use. Use of ventilation and windows will also vary over the duration of a journey and will depend on time of day, traffic and weather conditions. It is difficult for one study to cover all the combinations possible; however, by using volunteers who smoke, realistic sampling scenarios were produced in our study. It is worth noting that almost all the smokers in this study reported having conditions of high ventilation while they were smoking. It is unclear if, despite our requests to carry out their normal behaviour, they did in fact alter their fan and window use during the periods of measurement or if this is indeed their normal method of ventilating their car during smoking while driving.
From these data, it is not possible to describe the effect of ventilation on SHS concentrations in cars due to the small number of journeys that were classified as having ‘poor’ or ‘medium’ ventilation rates. However, it is safe to conclude from the data presented in figure 3 that SHS concentrations present during well-ventilated car journeys where smoking occurs are still much greater than WHO guidance level 16 for fine particulate matter.
We have used WHO PM2.5 guidance level as a comparison as this as WHO has recently stated that the value can be applied both to indoor and outdoor exposures.16 The comparison to this guidance should be done with some caution as this health-based value is based on a 24 h TWA. Clearly, the exposures during car journeys we have measured are all much shorter than a 24 h averaging period, but given recent work suggesting that there may be no safe level of exposure to SHS,18 we think that the use of WHO indoor air standards for PM2.5 is a reasonable health-based method of comparison. It is also important to consider that children who are exposed to SHS in cars may also be exposed to SHS within their home setting and so, while we do not have data here on 24 h average levels, it is reasonable to assume that the time spent in the car will only be one of several micro-environments where children may be exposed to SHS and hence elevated PM2.5 levels over the course of the day.
The results can also be compared with the concentrations of PM2.5 that were measured in recent studies of tobacco smoke levels in bars in Scotland and England prior to the implementation of smoke-free legislation in 2006 and 2007, respectively. The mean PM2.5 concentration measured in cars in this study, for journeys where smoking occurred, was 85 μg/m3 which is about one-third of the average exposure level measured in bars in Scotland (246 μg/m3) and a little over half of the average level measured in bars in England (142 μg/m3).2 Typical PM2.5 levels in bars now that smoking is prohibited are of the order of 5–10 μg/m3, similar to those measured in the non-smoking car journeys. The recent BMA briefing paper on smoking in vehicles9 initially stated that ‘the concentration of toxins in a smoke-filled vehicle is 23 times greater than that of a smoky bar, even under realistic ventilation conditions’19 and cited studies from controlled conditions.11 Our data do not support this claim nor the BMA's retraction issued the following day changing the text to ‘the concentration of toxins in a smoke-filled vehicle could be up to 11 times greater than that of a smoky bar’. Our study of a large number of real-life smoking journeys suggests that SHS concentrations measured over the duration of the journey are, on average, between one-half and one-third of the average levels measured in UK bars prior to smoke-free legislation.
There are some limitations that should be considered when interpreting the results reported in the current study. The selection of participants was carried out via local contacts of the two NHS tobacco control teams and it is therefore difficult to know how representative they are of typical smokers within the wider population. Only one of the participants had previously engaged with tobacco control services and so we do not believe that this group was particularly biased in terms of having a greater knowledge of the harmful effects of SHS than the wider smoking population though we did not explore this possibility directly. This study took place during two 1-week periods in October and March where ventilation in cars through the use of open windows or air conditioning is possibly more frequent than during winter months and so may underestimate SHS concentrations that would be experienced in winter. The converse is also true in that our data may be an overestimate of exposures in summer months. Although participants were asked to perform their normal behaviour, they were also being asked to switch on/off equipment and complete data sheets at the beginning and end of each journey which will have introduced some non-typical activity and may have changed the SHS exposure that was measured.
While it is important to be aware of these weaknesses and to consider how representative the measurements made in this study are, the high level of agreement with the only previous UK study of PM2.5 levels in cars suggests that the results are broadly valid and are likely to demonstrate typical SHS exposures of children in cars in the UK.
Given the well-accepted health impacts of SHS,20 it is important to consider methods to limit exposure of non-smoking car occupants and children in particular. Providing smokers and non-smokers with greater understanding of the concentrations of SHS generated during smoking within a car, coupled with information and education on the health effects of SHS must be a primary public health intervention. Stronger mandatory measures that prohibit smoking in private vehicles have already been implemented in parts of Canada and Australia and are currently being considered in the UK.7–9 Recent evidence suggests that there is growing support for legislation to protect children in cars from SHS exposure.4 ,5 The evidence from this paper is that SHS concentrations in cars where smoking takes place are likely to be harmful to health under most ventilation conditions. We believe that there is a clear need for legislation to prohibit smoking in cars where children are present.
Conclusions
The concentrations of fine particulate matter (PM2.5) found in cars where smoking took place were high and in all cases exceeded WHO 24 h indoor air guidance value of 25 μg/m3 for some considerable duration of the journey. Concentrations were strongly associated with the number of cigarettes smoked per time period. In our study, most smoking journeys appeared to involve some period of high ventilation conditions either in terms of window opening or use of the in-car fan. Despite this, exposure intensities during smoking car journeys remained considerable and taken as an average were about three times the WHO guidance concentration. Exposure to PM2.5 at the levels reported here is likely to be harmful to respiratory health, and measures to remove or reduce this exposure within the confines of vehicles should be considered both in terms of individual responsibility and via legislation.
What this paper adds
This is the largest study of secondhand smoke concentrations in cars during real-life journey conditions. The results indicate that smoking within a car leads to concentrations of fine particulate matter that exceed health-based limits and that such elevated levels are found even when smokers use ventilation systems and window opening to try to reduce smoke levels.
Acknowledgments
We would like to thank all the study participants. Thanks also to Hilary Cowie and Anne Sleeuwenhoek (Institute of Occupational Medicine) for their helpful comments and suggestions on earlier versions of this manuscript.
References
Supplementary materials
Press release
Files in this Data Supplement:
Footnotes
-
Funding This work was funded by the NHS Greater Glasgow and Clyde (NHS GGC) Tobacco Control Team and NHS Great Yarmouth and Waveney (NHS GY&W) Tobacco Control Team.
-
Competing interests None.
-
Patient consent Obtained.
-
Provenance and peer review Not commissioned; externally peer reviewed.