Article Text

Abstract
Objectives Flavours increase e-cigarette attractiveness and use and thereby exposure to potentially toxic ingredients. An overview of e-liquid ingredients is needed to select target ingredients for chemical analytical and toxicological research and for regulatory approaches aimed at reducing e-cigarette attractiveness. Using information from e-cigarette manufacturers, we aim to identify the flavouring ingredients most frequently added to e-liquids on the Dutch market. Additionally, we used flavouring compositions to automatically classify e-liquids into flavour categories, thereby generating an overview that can facilitate market surveillance.
Methods We used a dataset containing 16 839 e-liquids that were manually classified into 16 flavour categories in our previous study. For the overall set and each flavour category, we identified flavourings present in more than 10% of the products and their median quantities. Next, quantitative and qualitative ingredient information was used to predict e-liquid flavour categories using a random forest algorithm.
Results We identified 219 unique ingredients that were added to more than 100 e-liquids, of which 213 were flavourings. The mean number of flavourings per e-liquid was 10±15. The most frequently used flavourings were vanillin (present in 35% of all liquids), ethyl maltol (32%) and ethyl butyrate (28%). In addition, we identified 29 category-specific flavourings. Moreover, e-liquids’ flavour categories were predicted with an overall accuracy of 70%.
Conclusions Information from manufacturers can be used to identify frequently used and category-specific flavourings. Qualitative and quantitative ingredient information can be used to successfully predict an e-liquid’s flavour category, serving as an example for regulators that have similar datasets available.
- electronic nicotine delivery devices
- public policy
- surveillance and monitoring
- tobacco industry
This is an open access article distributed in accordance with the Creative Commons Attribution Non Commercial (CC BY-NC 4.0) license, which permits others to distribute, remix, adapt, build upon this work non-commercially, and license their derivative works on different terms, provided the original work is properly cited, appropriate credit is given, any changes made indicated, and the use is non-commercial. See: http://creativecommons.org/licenses/by-nc/4.0/.
Statistics from Altmetric.com
Introduction
Electronic cigarette (e-cigarette) use among various user groups has increased considerably over the past years.1 2 One of the most important reasons for e-cigarettes’ great popularity is the assortment of available e-liquid flavours3–6; for example, no less than 245 unique flavours were available in the Netherlands in 2017.7 Flavours increase product attractiveness among all types of (potential) users, that is, among youth and adults8 and among current smokers, dual users, exclusive vapers, as well as never-users.9 For smokers, switching to e-cigarettes may be beneficial, as e-cigarette use (ie, vaping) is considered less harmful than regular cigarette smoking.10–14 In line with this, the use and marketing of e-liquid flavours that are appealing to smokers may contribute to public health benefits. However, flavours may also stimulate vaping among non-users, in particular young people.15–17 This is concerning, as e-cigarettes are not safe10 18 19 That is, chemicals in e-cigarette emissions (eg, tobacco-specific nitrosamines, metals, aldehydes and other flavourings) can be toxic and thus harmful to consumers’ health.20–22 In addition, e-cigarettes may facilitate smoking initiation among never-smokers.23 As a consequence, e-liquid flavours are considered an important target in tobacco control in order to decrease e-cigarette attractiveness and use and thereby exposure to potentially toxic emissions.
One way of regulating e-liquid flavours could be restriction of flavour categories that are particularly appealing to non-users or youth. For example, the US Food and Drug Administration (FDA) recently announced that e-cigarettes with a flavour other than tobacco will be removed from the market until they are evaluated under the FDA’s new product review authority.24 Such rules often rely on flavour-related marketing descriptions, which do not necessarily reflect human perception and may differ between e-liquid providers and therefore can be challenging to enforce. In addition, allowing or banning a specific e-liquid flavour may be complicated as e-liquids regularly have multiple flavour descriptors (eg, tobacco with caramel and vanilla).7 Similarly, using sensory analysis to enforce e-liquid flavour regulations may be challenging. Although based on human perception, analysing sensory properties of all e-liquids in a particular country to determine whether they comply with current regulations is extremely time-consuming. However, sensory analysis could be used to determine attractiveness of particular e-liquid flavours or flavour categories among vulnerable user groups (eg, non-smoking adolescents) and in that way inform policy makers on how to reduce e-liquid appeal. Another option would be to decrease e-liquid attractiveness or toxicity by restricting the addition of particular flavouring ingredients. For example, particular flavourings could be banned or their maximum concentration could be restricted. This may diminish e-cigarette use and thereby exposure to potentially toxic e-liquid constituents and thus increase health benefits for non-users and youth.
Research on e-liquid flavours and flavouring compositions can support regulators in developing policy measures. Accordingly, various chemical analytical studies evaluated e-liquid flavouring ingredients and emissions.21 25–29 These studies typically focus on a list of a priori selected target flavourings for their analyses.21 25–29 These target lists are usually selected based on previous studies, which creates a risk of selection bias by overlooking other or new e-liquid ingredients that may have toxic properties. Therefore, there is a clear need for a published overview of common flavourings and other ingredients in e-liquids. This information may be used as a starting point for future chemical analytical researchers in developing their target lists, may provide targets for future toxicological studies and may provide foci for regulation of e-liquid flavourings.
We previously generated an overview of all e-liquid flavour descriptions reported to be marketed in the Netherlands in 2017,7 by manually classifying almost 20 000 e-liquids into 16 main flavour categories.30 Classification was based on e-liquids’ flavour-related information reported by manufacturers. In the European Union, manufacturers are also required to provide information about their e-liquids’ chemical composition. Using this information, the current study first aims to identify the most commonly used e-liquid flavourings in general and to determine potential flavourings that are specific to a single flavour category.
In our previous study, we used information from manufacturers such as brand names to manually classify e-liquids by flavour description.7 However, 2586 e-liquids (15% of the entire dataset) could not be classified as flavour-related information was unspecific, incomplete or even unavailable. For example, it was not possible to classify e-liquids with generic brand names that are unrelated to a flavour (eg, ‘Spaceship’ or ‘Purple Unicorn’, hypothetically). Manufacturers additionally reported information about their e-liquids’ chemical composition. Therefore, the second aim of this study is to determine whether this information can be used to predict e-liquids’ flavour categories, using a machine learning algorithm. Such automatic classification of e-liquids by flavour would allow to easily create market overviews of e-liquid flavour descriptions worldwide in a time-effective and cost-effective manner, provided that information on e-liquid ingredients is available.
Methods
Data collection and preparation
According to the European Tobacco Product Directive, tobacco and e-liquid manufacturers are required to provide information such as brand names, ingredients and emissions of the products they have marketed in each Member State. A complete dataset of all e-cigarette products on the Dutch market was extracted from the European Common Entry Gate system (EU-CEG)31 on 30 November 2017. For this study, only e-liquids were included (ie, no other products, such as devices). Duplicate submissions and products with incomplete information were excluded, resulting in a dataset of 19 266 products.
In a previous study, flavour-related information about each e-liquid was obtained from the EU-CEG system. According to a standardised approach, e-liquid flavours were classified into one of the following 16 main flavour categories: tobacco, menthol/mint, nuts, spices, coffee/tea, alcohol, other beverages, fruit-berries, fruit-citrus, fruit-tropical, fruit-other, dessert, candy, other sweets, other flavours and unflavoured.7 30 E-liquids were considered ‘unclassifiable’ if they were not found on the internet (n=1680; 9% of total sample) or could not be searched for due to the EU-CEG information being too general (eg, only referring to a brand or product range, n=906; 5% of total sample).7
Data analyses
As most e-liquids were reported as being marketed in a package unit of ‘1’ and containing 10 mL of fluid, deviating submissions (more than one e-liquid per package or e-liquids with a volume other than 10 mL) were excluded. This resulted in a final dataset of 16 839 products. For these products, ingredient-related information was extracted from the EU-CEG system and analysed using R statistical software (version 3.5.1). Ingredients reported by manufacturers as having the function ‘Flavour and/or Taste Enhancer’ will be referred to as flavourings. Negative values for ingredient amounts (resulting from EU-CEG artefacts) were set at zero. For the overall dataset, as well as for individual flavour categories and the unclassifiable subset separately, the following values were determined: the number of products, the mean number of total ingredients, the mean number of flavourings per product, the mean total number of ingredients per product and the mean quantities of all flavourings per product.
Ingredients present under multiple names in the EU-CEG system (eg, ethanol, etanolo, etanol, ethyl alcohol, ethyl alkohol, ethyl-alcohol, alcool ethylique and EtOH) were merged into one ingredient name. First, unique ingredient names were identified (n=8352), including the number of products for which they were reported in the EU-CEG system. Next, starting with the most frequently reported ingredients names, we manually searched for other names that represented the same ingredient and thus could be grouped together. This was done using CAS registry numbers (ie, assigned by the Chemical Abstracts Service), FEMA registry numbers (ie, assigned by the Flavor Extract Manufacturers Association), trivial names, translations of ingredient names and text cleanup (eg, removing upper/lower case redundancy and spelling mistakes). This process was repeated until all ingredient names that were initially reported in more than 100 products (ie, more than 0.6% of all products) were checked. This resulted in a final list of 219 unique ingredients.
For further analysis, solvents (propylene glycol, glycerol, ethanol, water and triacetin) and nicotine were excluded. For the remaining 213 flavourings, we identified the flavourings that were present in at least 10% of all products (n=25 flavourings), as well as the median quantity (mg/10 mL) in which they were added. This was also done for each individual flavour category and for the set of unclassifiable products (n=94 flavourings in total).
Next, quantitative information of the flavourings that were present in at least 10% of the products in any flavour category were used for machine learning prediction of an e-liquid’s class (ie, flavour category) using the random forest (RF) algorithm32 in the randomForest R package. First, the 14 253 products that were assigned to one of the 16 flavour categories were used for RF classification. A fivefold cross-validation was used, for which the data were randomly split into five subsets containing approximately the same number of products and similar distributions of the flavour categories. Next, ingredient information about 80% (4/5 subsets) of the products was used to train a model that predicted the class of the other 20% (1/5) of the products; this was done five times. Additional R settings selected included the number of trees (ntree=2000) and the option to return both the predicted class label and the probabilities for each class. Resulting data were used to evaluate the overall prediction accuracy. For this, we determined how many products were assigned to the correct class according to the RF model (ie, the flavour category with the highest probability). In addition, we determined for how many incorrectly assigned products the correct class received the second highest probability according the RF model (including tied second place). To determine the chance-based prediction accuracy, we randomly reassigned each product to one of the categories and repeated the machine learning analysis. This resulted in an overall chance accuracy of 10.2%. Finally, we trained a model using quantitative information about the complete set of 14 253 products with an assigned flavour category to predict the class of the 2585 products defined as ‘unclassifiable’ in our previous study.7
Because quantitative information is not always reported, the analyses were repeated using qualitative information about the ingredients only to provide a proof of principle that the method can also be used for qualitative data.
Results
Mean number of flavourings
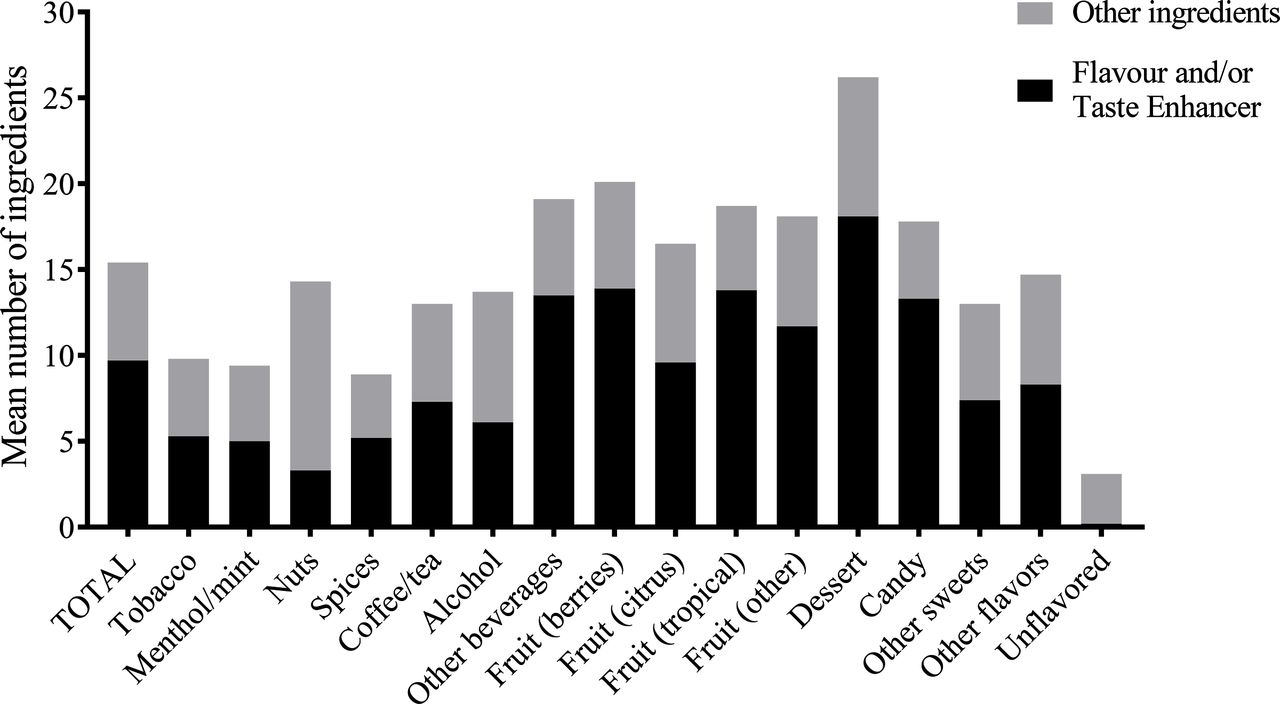
Over all 16 839 e-liquids, the mean number of reported flavourings per e-liquid was 10±15. Figure 1 shows the mean number of flavourings and other ingredients in total and for each of the separate flavour categories. The mean number of flavourings per flavour category (excluding unflavoured) ranged from 3±8 (for nuts) to 18±20 (for dessert).
Mean number of ingredients indicated as having a ‘flavour and/or taste enhancer’ function (black) and ingredients with another function (grey) in total and for each of the separate flavour categories. Other functions of ingredients may include addictiveness enhancers, carriers, casings, fibres, humectants, solvents, processing aids, smoke odour modifiers, water-wetting agents and viscosity modifiers.36
On average, 63% of the total number of ingredients within one e-liquid were flavourings. The mean number of flavourings as percentage of the total number of ingredients (excluding unflavoured) was highest for e-liquids classified as candy (75% were flavourings) and lowest for nuts (23% were flavourings). The median concentration of total flavourings per e-liquid was 28.0 mg/10 mL.
Most frequently added flavourings and their quantities
We identified 219 unique ingredients reported to be added to more than 100 e-liquids of the entire dataset. An overview of these ingredients, including their prevalence, is shown in online supplementary table S1. This overview covers 99.4% of all unique ingredients (n=8352) reported. Ingredients other than flavouring ingredients were glycerol, nicotine, propylene glycol, water, ethanol and triacetin. These compounds were present in, respectively, 94%, 88%, 86%, 45%, 23% and 15% of all e-liquids.
Supplemental material
Twenty-five flavouring ingredients were added to more than 10% of the overall sample of e-liquids (see table 1). The most frequently used flavourings were vanillin (present in 35.2% of the total set), ethyl maltol (32.0%) and ethyl butyrate (28.4%). The highest median concentration was reported for menthol (18.4 mg/10 mL) and the lowest median concentration was reported for benzaldehyde (0.3 mg/10 mL).
The top 25 most frequently added flavouring ingredients in e-liquids from the EU-CEG dataset
The five flavourings that were most frequently used per separate flavour category are listed in table 2. Online supplementary table S2 shows an overview of all flavourings added to more than 10% of the e-liquids for each flavour category separately. Only two flavourings, ethyl maltol and vanillin, were added to more than 10% of the e-liquids of all flavour categories (except for unflavoured). However, 29 flavourings were added to more than 10% of the e-liquids in a single category (excluding those specific to the other flavours category). These ‘category-specific’ flavourings were: β-damascone (for tobacco); eucalyptol, menthone and peppermint oil (for menthol/mint); 2,5-dimethylpyrazine, 2–3-hexanedione, 4,5-dimethyl-3-hydroxy-2,5-dihydrofuran-2-one, 5-methyl furfural, γ-dodecalactone and triethyl citrate (for nuts); anethole and trans-anethole (for spices); ethyl heptanoate, ethyl nonanoate, isoamyl alcohol and lactic acid (for alcohol); cinnamaldehyde (for other beverages); dimethyl sulfide and propionic acid (for fruit-berries); orange oil (for fruit-citrus); isobutyl acetate and trans-2-hexenal (for fruit-other); and 4-methyl-5-thiazole ethanol, anisyl alcohol, benzyl benzoate, γ-hexalactone, methyl-alpha-ionone, methyl-thio-methyl-pyrazine and propenyl guaethol (for dessert). See online supplementary table S3 for flavour descriptions of these ingredients.
Overview of the top five most frequently added flavourings for each individual flavour category30
Predictive value of flavouring composition
Using information about ingredient quantities, 9982 of 14 253 e-liquids were assigned to the correct flavour category. This means that the overall prediction accuracy of the RF algorithm was 70%. For 3740 incorrectly assigned products (26% of total e-liquid sample), the correct class (ie, the manually assigned class) received the second highest probability.
Using the RF model to predict the flavour category of the e-liquids that were defined as ‘unclassifiable’ in our previous study7 resulted in: 56% of these e-liquids being classified as tobacco; 10% as fruit-other; 9% as fruit-berries; 7% as menthol/mint; 7% as dessert; 3% as alcohol; 3% as other sweets; 2% as fruit-citrus; 2% as fruit-tropical; 1% as coffee/tea; and 1% as other beverages (see online supplementary table S4).
Finally, when only using information about the presence of ingredients rather than their amounts (a qualitative rather than quantitative approach), the RF algorithm had an overall prediction accuracy of 66%.
Discussion
This study provides an overview of frequently added ingredients, and their quantities, in all e-liquids available on the Dutch market in 2017. In total, 219 unique ingredients were identified, covering 99.4% of all ingredients reported to be used in our dataset of 16 839 e-liquids. On average, 63% of the total number of ingredients per e-liquid were flavourings and the mean number of flavourings per e-liquid was 10. Common non-flavouring ingredients were glycerol, nicotine, propylene glycol, water, ethanol and triacetin. Vanillin, also one of the mostly used additives in tobacco products33 for its sweet, creamy, vanilla-like flavour,34 was the flavouring most frequently added to e-liquids. The overall median concentration was highest for menthol: a compound that is commonly added to tobacco products for its cooling and smoothing effects.35 The highest mean numbers of flavourings were found for flavour categories that typically contain sweet e-liquids such as dessert, other beverages, fruit and candy. As our results showed category-specific flavouring patterns, we were able to successfully predict an e-liquid’s flavour category based on patterns of flavouring compositions (70% accuracy).
Main applications
Our study provides a comprehensive overview of flavourings added to e-liquids, including their quantities, thereby giving directions to other researchers for selection of target compounds in their future chemical analytical and toxicological studies regarding e-liquid flavourings. For example, based on their research questions, researchers can use our data to select any number of most frequently used flavourings, or flavourings that are unique to particular flavour categories.
In addition, our study showed that using a machine-learning algorithm on a dataset on e-liquid flavouring compositions can provide a reliable estimation of marketed e-liquid flavours. The algorithm can be successfully applied using both ingredient quantities as well as qualitative information only. The resulting overview of marketed e-liquid flavours and their distribution across categories can be used for comparative analyses between regions or countries and to keep track of market trends. Finally, regulators can combine our results with sensory data on flavour preferences from (potential) consumers to define regulatory targets for reducing e-liquid appeal and use among vulnerable user groups (eg, non-smokers and youth).
Considerations regarding the information source
It should be noted that the information used in this study was provided by the industry, without the aim of sustaining research, and were not validated by an independent party. Therefore, while manufacturers were instructed to report ingredient quantities in weight per product unit (ie, mg/10 mL),36 it is uncertain whether all ingredients were reported in the correct unit. Due to the large size of the dataset used in this study, potential data artefacts are expected to not have influenced overall results. Yet, as information was provided by the industry, results should be interpreted with appropriate caution. In addition, as the EU-CEG information used in this study was extracted at a single time point, results may not be generalisable over time. Therefore, regular follow-up analyses would be worthwhile to get more insight into the dynamics of the e-liquid flavour market.
Benefits and limitations of automatic classification
The overall accuracy of predicting an e-liquid’s flavour category based on patterns of flavouring compositions was 70% using ingredient quantities. This is almost seven times higher than chance level (10.2%) and was only slightly lower when only qualitative information was used (66%). This shows that our approach provides a reliable estimation of the distribution of flavour categories on market or country level. It should be noted that the algorithm is not necessarily suitable for predicting flavour categories of individual products. Nevertheless, an important benefit of automatically classifying e-liquids over manual classification is that it significantly limits the time and workload needed to classify a large sample of products.
Other important advantages of classification based on ingredients are that it is insensitive to interpretation of flavour descriptions and allows for classification of products with ambiguous brand names (eg, ‘Spaceship’, hypothetically) or lacking flavour-related marketing information. In our previous study, a set of 2586 e-liquids could not be classified in any flavour category, due to unavailable or unspecific flavour-related information. However, using the RF algorithm and ingredient information, we were able to classify these e-liquids in addition to the other 14 253 products, thus provide a complete census of e-liquids on the Dutch market.
While the overall prediction accuracy was high, 30% of all e-liquids were misclassified. It is important to note that, in this study, an e-liquid was considered ‘misclassified’ when the RF algorithm assigned it to a flavour category different from the one it was assigned to in the manual classification approach.7 The term ‘misclassified’ is debatable: an e-liquid that was misclassified by the RF algorithm may actually better fit the category to which it was assigned by the algorithm than the category to which it was assigned by manual classification. For example, a hypothetical e-liquid marketed as ‘strawberry and mint’ would be manually classified in the fruit-berries category, because strawberry was the first flavour description mentioned (see classification guidelines in ref 30). However, this e-liquid may contain more menthol-related than strawberry-related flavouring ingredients, thus being potentially classified in the menthol/mint category by the RF algorithm. Whether the correct flavour category is fruit-berries or menthol/mint is debatable, so this type of considerations increases difficulties regarding e-liquid flavour classification.
In this study, for most of the e-liquids that were misclassified (87.5%), the correct class received the second highest probability. This shows that, if the algorithm assigned a product to the wrong class, the correct flavour category was usually second best. In these cases, the e-liquid flavour closely relates to multiple flavour categories. This can be caused by one e-liquid containing ingredients with flavour descriptions related to multiple categories, or ambiguous flavour-related marketing information that can be interpreted as relating to more than one flavour category. For example, an e-liquid marketed as ‘apple pie’ (and thus classified in the main category dessert) may contain a mixture of ingredients that are separately described as having an apple, cinnamon or pie flavour. Due to this combination of flavourings, this e-liquid may be as much likely to be classified in the fruit-other, spices or dessert category. Other examples of such misclassifications in our dataset are: (1) an e-liquid with ‘peanut butter, vanilla & banana’ flavour, incorrectly assigned to other sweets while manually classified as nuts and (2) an e-liquid with ‘lemonade’ flavour, incorrectly assigned to fruit-citrus while manually classified as other beverages. The existence of products with such combined flavours makes both automatic and manual flavour classification challenging.
To improve classification results, classification of some products could be reconsidered, particularly of the products of which the probability of the assigned category is rather low, or of which probabilities of the assigned category and the second-best category differ not much. For example, this could be a product that is classified in the fruit-other category with a probability of 49% and received a probability of 46% for the dessert category (second-best). These e-liquids could be manually reclassified, for example, using flavour-related information from web shops or using sensory analysis, provided that these e-liquids are still on the market at the time of data analysis. It should be noted that, although classifying e-liquids based on human expert judgement would be an accurate approach, training a panel to identify each e-liquid’s flavour would be time-consuming.
Most misclassifications occurred in categories containing a low number of products (ie, unflavoured, nuts and spices), which may be due to the fact that they contained fewer examples for training the algorithm. Besides, a relatively high number of products from the other flavours category were incorrectly assigned to other categories. This seems inevitable as the e-liquids in this category do not have a certain common flavour but instead have miscellaneous flavours that did not fit in any other category. Hence, correct classification for the other flavours category is more difficult but also less relevant as this category is by definition a heterogeneous group.
Finally, it should be noted that our analyses were based on flavourings that were reported to be added to more than 100 e-liquids of the entire dataset (ie, more than 0.6% of the 16 839 products). Hence, a few seldom reported ingredients are not represented in our comprehensive overview of e-liquid ingredients. In addition, only e-liquids with a volume of 10 mL were included in this study. Therefore, results do not include cartridges and prefilled e-cigarettes.
Conclusions and recommendations
We analysed e-liquid ingredients and provided an overview of the flavouring ingredients most frequently reported to be added to e-liquids and their quantities. Besides similarities between flavour categories, we identified flavourings that were specific to only one flavour category. Moreover, we successfully predicted e-liquids’ flavour categories based on their flavouring composition with 70% accuracy. Automatically classifying e-liquids in this way allows to quickly generate an overview of marketed e-liquid flavour descriptions in a particular country. Thus, we recommended regulators to request information from manufacturers regarding the compositions of all marketed e-liquids to be able to perform similar analyses. This may help to support compliance and control of potential future regulations of e-liquid flavours.
What this paper adds
What is already known on this subject
Flavouring ingredients increase e-cigarette attractiveness and use, particularly for young non-smokers, and thereby increase exposure to potentially toxic ingredients.
Chemical analysis can be used to identify and quantify e-liquid flavouring ingredients.
What important gaps in knowledge exist on this topic
A comprehensive overview of e-liquid ingredients is needed as a starting point for chemical analytical and toxicological research and for regulatory approaches aimed at reducing e-cigarette attractiveness.
Instead of manual classification of e-liquids by flavour using marketing descriptions, an automatic approach is needed to create market overviews of e-liquid flavours worldwide in a time-efficient manner.
What this paper adds
This study is the first to use information from manufacturers to create a comprehensive overview of e-liquid flavourings and their quantities, which may give direction to future research on e-liquid flavourings and may support flavouring-level regulation to decrease attractiveness of e-liquids.
Our approach of automatically classifying e-liquids into flavour categories using their compositions was successful (70% accuracy) and allows to quickly generate market overviews of e-liquid flavours that can be compared between countries.
References
Supplementary materials
Supplementary Data
This web only file has been produced by the BMJ Publishing Group from an electronic file supplied by the author(s) and has not been edited for content.
Footnotes
EJZK and AH contributed equally.
Contributors EJZK and AH contributed equally. EJZK, AH and RT conceptualised and designed the study. JP prepared and analysed the data. EJZK and AH interpreted the data and wrote the manuscript. SB, KdG, JP and RT provided critical feedback on the manuscript.
Funding The Ministry of Health, Welfare and Sport (VWS), project 5.7.1.
Competing interests None declared.
Patient consent for publication Not required.
Provenance and peer review Not commissioned; externally peer reviewed.
Data availability statement Processed data are available on reasonable request to the first author. Raw data are confidential and cannot be shared.