Article Text

Abstract
Background Tobacco taxes, as with other ‘sin taxes’, are generally regarded as a highly cost-effective mechanism to reduce consumption but are often considered by policymakers to be regressive, undermining efforts to fully implement them at levels recommended by the WHO due to concerns of fairness. We aim to demonstrate whether there are circumstances in which the impacts of additional tobacco taxes are not regressive, using a standard income-share accounting definition of tax burden.
Methods and findings We apply mathematical modelling and explore the hypothetical distributions in the net change in tobacco taxes and cigarette expenditures by income group, following an increase in tobacco taxation. The hypothetical distribution per income group of additional taxes and cigarette expenditures borne by individuals following tobacco tax hikes was calculated with respect to a selection of parameters including: the change in the retail price of cigarettes, the price elasticity of demand for tobacco, smoking prevalence, cigarette consumption and individual income. We determine the range of hypothetical parameter values for which increased tobacco taxation should not be considered to penalise the poorest income groups when examining marginal cigarette consumption expenditures and using an accounting definition of tax burden.
Conclusions Our findings question the doctrine that tobacco taxes are uniformly regressive from a standard income-share accounting view and point to the importance of the specific features of tax policy to shape a progressive approach to tobacco taxation: tobacco tax increases are less likely to be regressive when accompanied by a broad framework of demand-side measures that enhance the capacity of low-income smokers to quit tobacco use.
- taxation
- socioeconomic status
- global health
- disparities
Data availability statement
All data relevant to the study are included in the article or uploaded as supplementary information.
This is an open access article distributed in accordance with the Creative Commons Attribution Non Commercial (CC BY-NC 4.0) license, which permits others to distribute, remix, adapt, build upon this work non-commercially, and license their derivative works on different terms, provided the original work is properly cited, appropriate credit is given, any changes made indicated, and the use is non-commercial. See: http://creativecommons.org/licenses/by-nc/4.0/.
Statistics from Altmetric.com
Introduction
Globally, tobacco smoking is the largest single preventable cause of mortality for non-communicable diseases, including cardiovascular diseases and cancer, and its death toll rose to an estimated 7 million premature deaths in 2017.1 As an illustration, China now counts more than 300 million adult smokers,2 resulting in an estimated 2 million premature deaths each year.1 The total number of smokers globally is estimated to be almost 1 billion persons and rising year on year in absolute terms.3
A comprehensive consensus array of evidence-informed tobacco control measures, including enforcement of smoke-free zones, advertising bans and taxation of tobacco products has been adopted with success in many global jurisdictions.4 Importantly, the World Health Organization’s (WHO)’s Framework Convention on Tobacco Control (FCTC), now ratified by 181 countries, commits those countries to implement an array of tobacco control interventions summarised in specific articles of the FCTC through legislative or regulatory actions.5
Taxation of tobacco products is generally regarded as the single most cost-effective public health strategy for reducing smoking prevalence, through promotion of smoking cessation and prevention of smoking initiation.6–10 However, few countries have implemented taxation policies that meet the criteria outlined under the FCTC’s 2005 implementation platform, MPOWER,11 which calls for tax rates to constitute at least 75% of the final retail price.4 By 2008, about 20 countries had adopted the recommended taxation on tobacco products, yet in 2018, just 40 countries had adopted the FCTC standard.4 This situation underscores the deadly paradox that the most effective tobacco control policy is also the least widely implemented of the MPOWER recommendations.11 12
A major reason for the lack or delay in enforcement of large tax hikes on tobacco products is that often tobacco taxes are deemed to be inherently regressive.13 14 Qualifying taxes of regressive mean that they disproportionally hurt the poorest income groups: the traditional regressivity argument states that less affluent smokers incur proportionately greater expenditures on cigarettes compared with more affluent smokers; this is the accounting definition of tax burden,15 causing greater financial hardship to a population already impacted by problems of tobacco dependence and associated diseases.9 14 16 This view makes increasing tobacco taxation politically and morally less palatable than other measures. International agencies such as the WHO and the World Bank have nonetheless strongly supported tobacco taxation over the last three decades and pointed to the broader considerations of health benefits, mortality reduction, curbing out-of-pocket (OOP) health spending and reducing the economic burden of tobacco-related disease.17 18 However, some notable exceptions exist, including the International Monetary Fund, which had remained publicly agnostic on the question of tobacco taxes until recently. They have also now endorsed them.19
As Remler well documents,14 several definitions of tax burden can be employed to qualify tobacco taxes, including: comparing cigarette expenditures relative to income (the standard income-share accounting definition—the one we take in this paper); examining consumption changes and corresponding welfare-based willingness to pay of individuals; and considering welfare-based time-inconsistent preferences and ‘internalities’ of individuals (ie, smokers want to quit but cannot in the short term and want a commitment device (ie, higher taxes) forcing them to quit in the long term).20
Contesting the traditional view of tax regressivity, based on the sole examination of distributional cigarette consumption expenditures, a number of studies have examined broader outcomes of tobacco tax policy (including both financial and health measures, beyond simply the accounting burden of taxation) for individuals and households and have concluded that tobacco taxation can be ‘pro-poor’ in terms of its totality of effects.21–28 For example, tobacco taxation can reduce OOP health expenditures and the loss of income from smoking-related disease. Notably, analyses by the World Bank24 including from Fuchs and Meneses25 26 of tobacco taxes call into question the overall regressivity of tobacco taxation, and a number of extended cost-effectiveness analyses21 23 27 28 have demonstrated an overall progressive distributional impact across income groups of increased tobacco taxes when accounting for the additional outcomes of health benefits and financial risk protection.
Importantly, Remler,14 using the accounting definition of tax burden (net change in cigarette expenditures relative to income), qualitatively demonstrates that a tax increase can be progressive for certain income gradients in price elasticity of demand for tobacco and smoking prevalence. In this regard, a number of studies have quantitatively examined this distributional impact of higher tobacco taxes while accounting for differential price responsiveness across a range of income groups.14 29–35 Specifically, smokers of lower income have been shown to be more price sensitive to tobacco price increases than smokers of higher income.23 28 29 32 33 36–44 Likewise, adolescent and young adult smokers (aged 25 years and younger) are typically more price sensitive than adults to increased cigarette price.45 46 That is, as price increases, decrease in demand for cigarettes may be disproprortionately greater among price-sensitive populations. Therefore, increased tobacco taxes need not be inherently regressive when differential price sensitivity by income stratum is considered and thus provide a strategy to target price policies to populations with higher smoking prevalence.
In this paper, we aim to ascertain whether there are circumstances in which the impacts of additional tobacco taxes are not regressive, using a standard income-share accounting definition of tax burden. We employ the accounting definition of tax burden and study the distribution in the net change in tobacco taxes/expenditures following increased taxes. By focusing on such an incremental accounting measure of regressivity, many might disagree with this consideration of regressivity (ie, incremental vs baseline). We do not argue about how regressivity should be defined in the context of tobacco taxation, which we acknowledge is constitutive of the debate on whether tobacco taxes are deemed regressive, and multiple definitions of regressivity exist. Rather, our accounting focus contributes only one piece to this broader debate, which is beyond the scope of our paper, and has been well described.14 Specifically, we develop a mathematical model to examine the potential distributional impact of additional taxes and cigarette expenditures borne by individuals across income strata, using a range of hypothetical parameter values for the relative price change in cigarettes, the price elasticity of demand for tobacco and the prevalence of smoking and consumption of cigarettes. Subsequently, we highlight under which circumstances (ie, range of key parameter values), increased tobacco taxes may or may not be regressive from a standard income-share accounting point of view.
Methods
Modeling approach
We develop a simple mathematical model to examine the net change in the burden of tobacco tax across income groups following an increase in the retail price of cigarettes through taxation at the population level (figure 1).
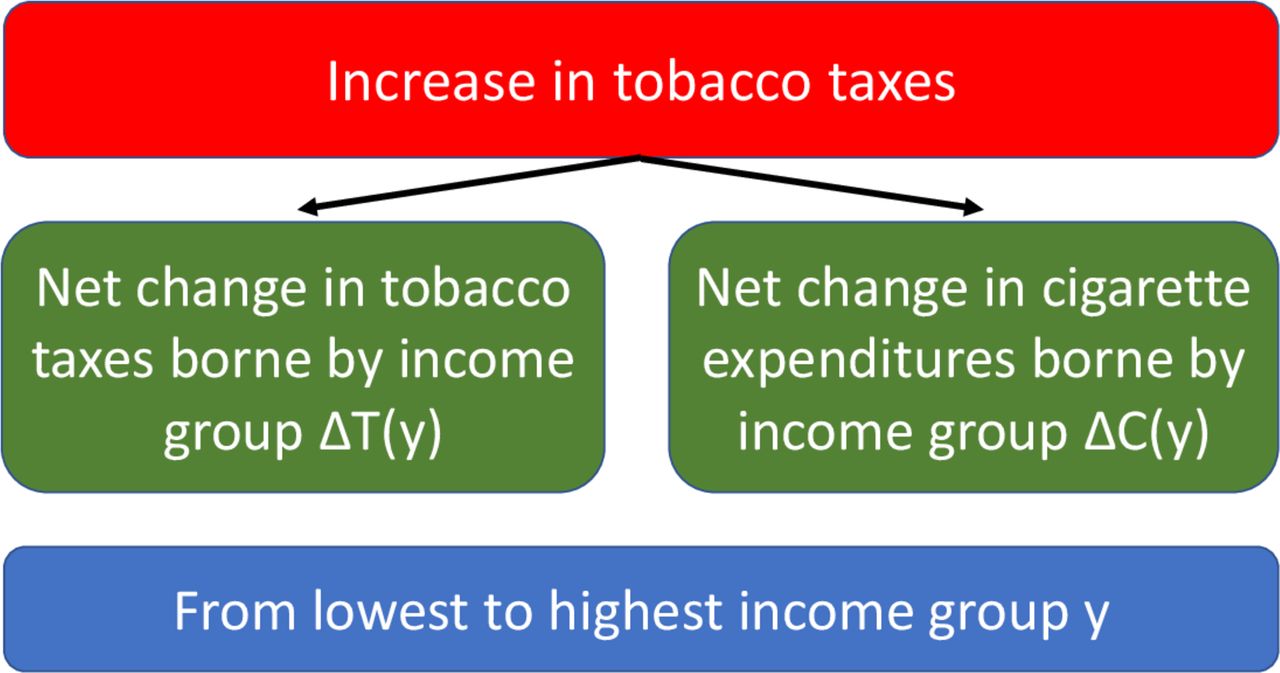
Conceptual framework summarising the distributional accounting model of increased tobacco taxation impacting on the net change in tobacco taxes (denoted ΔT(y), varying with income) and the net change in cigarette expenditures (denoted ΔC(y), varying with income) borne by individuals with income y.
The model incorporates the following parameters essential in the understanding of increased tobacco taxation: the prevalence of smoking
s
; the consumption
c
of cigarettes per year (eg, the number of cigarette packs consumed by smokers); the retail price
p
of cigarettes ( before increased taxation;
  after); the share
t
of tobacco taxes within the retail price of cigarettes (
after); the share
t
of tobacco taxes within the retail price of cigarettes ( before increased taxation;
  after); the change in price
  (equal to the amount of increased taxation
  ); the price elasticity of demand for cigarettes
ε
; and
y
, the income of a given individual in the population. Smoking prevalence, cigarette consumption and price elasticity of demand all can vary with
y
, hence, we denote:
); the price elasticity of demand for cigarettes
ε
; and
y
, the income of a given individual in the population. Smoking prevalence, cigarette consumption and price elasticity of demand all can vary with
y
, hence, we denote:  ,
,  and
and  . Often, though not always, lower income groups smoke more29 47–49 and are more price sensitive than more affluent income groups.6 22 28 29 32 33 36–44 In what follows, for simplicity, we group smoking prevalence and consumption in one variable
  , which corresponds to total cigarette consumption (table 1). Importantly, we use an accounting definition to assess progressivity/regressivity of increased taxation (eg, net change in taxes and expenditures relative to income), which is one (among several possible) definition of tax burden as described elsewhere.14
Key input variables used in the mathematical model depicting the distributional impact of increased tobacco taxation using a standard income-share accounting definition of tax burden
We now present the main elements of the mathematical model. Before increased taxation, at the population level, the total annual taxes borne by an individual with income
y
(denoted  ) corresponds to the total number of cigarettes consumed annually by the individual times the retail price of cigarettes and the tax share within the retail price:
 (1)
(1)
After increased taxation, at the population level, the total annual taxes borne by an individual of income
y
(denoted  ) corresponds to the reduced number of cigarettes consumed annually by the individual (
 ) times the new taxes included in the new retail price (
 ):
):
 (2)
(2)
Subsequently, we can derive, at the population level, the net change in taxes borne by an individual of income
y
(denoted  ) in the following way:
 (3)
(3)
Studying the regressivity (income-share accounting view) of the net change in taxes  implies examining whether
  as a proportion of
y
is greater for lower incomes than for higher incomes: this would mean that the tax increase is regressive. On the contrary, if
as a proportion of
y
is greater for lower incomes than for higher incomes: this would mean that the tax increase is regressive. On the contrary, if  as a proportion of
y
is greater for higher incomes, this would mean that the tax increase is progressive. Given the mathematical formulation of
as a proportion of
y
is greater for higher incomes, this would mean that the tax increase is progressive. Given the mathematical formulation of  , studying the regressivity implies exploring the monotonous character, with respect to
y
, of the function
, studying the regressivity implies exploring the monotonous character, with respect to
y
, of the function  . That is, regressivity would imply that
  decreases as
y
increases. Mathematically, this means that we need to explore the sign of the first derivative with respect to
y
of the function
decreases as
y
increases. Mathematically, this means that we need to explore the sign of the first derivative with respect to
y
of the function  (see online supplementary webappendix, section 1).
Supplemental material
Similarly, we can study the net change in cigarette expenditures across incomes
y
(denoted  ) at the population level. Importantly, the net change in cigarette expenditures captures the net financial burden borne (seen) by individuals via increased taxation. Given the mathematical proximity between the retail price (
p
) and the tax share within the retail price (
t
), we can derive mathematical expressions for the net change in cigarette expenditures that are consistent with those for the net change in cigarette taxes (see online supplementary webappendix, section 2).
) at the population level. Importantly, the net change in cigarette expenditures captures the net financial burden borne (seen) by individuals via increased taxation. Given the mathematical proximity between the retail price (
p
) and the tax share within the retail price (
t
), we can derive mathematical expressions for the net change in cigarette expenditures that are consistent with those for the net change in cigarette taxes (see online supplementary webappendix, section 2).
Estimates for price elasticity of demand and smoking prevalence
There exists an abundant literature that has derived estimates for the price elasticity of demand for tobacco products, mostly for high-income countries and for low-income and middle-income countries.50–52 These studies exhibit aggregate demand estimates generally ranging between −1.20 and 0.00. For the USA, aggregate estimates were clustered around −0.60 to −0.20; and for low-income and middle-income countries, they varied from −1.00 to −0.20. In addition, it was found that lower income groups would be substantially more price responsive than higher income groups.29 For instance, demand estimates could range from −1.00 among the lowest income group to 0.00 among the highest income group in the UK and Thailand36 53, and/or they could be twice as high among the lowest (vs highest) income group in the USA, Canada, Korea, Indonesia and Turkey.33 35 43 44 54 Lastly, young people are more responsive (two to three times45) than older adults to changes in prices of tobacco products: demand estimates among young people could be as high (in absolute value) as −2.20 or −1.50.46 55 In light of these empirical estimates (table 2), in our model, we conservatively assumed that price elasticity of demand for tobacco ( ;
;  ) could vary within −1.00 to −0.20.
Selected observed estimates for the price elasticity of demand for tobacco products and the prevalence of smoking across income groups, various countries and time-periods
With respect to smoking prevalence, our literature review29 47–49 found that in a wide variety of countries (high income, low income and middle income), there could be as many as one to two times more smokers among the lowest (vs highest) income group (table 2). Therefore, in our model, we assumed that smoking prevalence would decrease as income increases, and we applied a variety of negative income gradients in smoking prevalence.
Case studies examined
For ease of interpretation, we assumed that price elasticity was linearly changing with income
y
:  ;
;  is the income gradient in elasticity and
  the elasticity for individuals with lower income (ie, the poorest) (note that the young, with less disposable income, would be more concentrated among the poorest). This is consistent with the expectation that elasticity would decrease (in absolute value) with income (table 2). We also assumed that smoking and consumption (total cigarette consumption) would vary linearly with
y
:
the elasticity for individuals with lower income (ie, the poorest) (note that the young, with less disposable income, would be more concentrated among the poorest). This is consistent with the expectation that elasticity would decrease (in absolute value) with income (table 2). We also assumed that smoking and consumption (total cigarette consumption) would vary linearly with
y
:  ;
;  is the income gradient in cigarette consumption and
  the consumption for the poorest. This would be consistent with the expectation that smoking prevalence and consumption decrease with income (table 2). Potentially, other mathematical expressions (in lieu of linear functions) for
  and
and  could be selected but would unnecessarily complicate our analysis without giving additional insight. The resulting mathematical expressions are detailed in the online supplementary webappendix, section 3.
We studied parametrically two scenarios. Scenario 1 assumed total cigarette consumption constant across income:  . Scenario 2 relaxed this assumption with
  . In our study, income was normalised:
  ;
;  and
and  defined lower (poorest) and higher (richest) incomes, respectively. We denoted
  the relative change in cigarette price. We then examined when the resulting net cigarette taxes and expenditures would be regressive, progressive or neutral across income, and we quantified the extent of those situations.
Lastly, we applied our model to a number of country case studies including specific populations, time-periods, cigarette retail prices and tax regimes, which covered a parameter space drawn from empirical studies and reasonable assumptions (table 3).
Selection of country case studies including specific populations, time-periods, cigarette retail prices and cigarette tax regimes
All mathematical derivations and computations are provided in the online supplementary webappendix and were conducted using Mathematica (version 11.2.0.0, Wolfram Research, Inc).
Results
We report in this section on the examination of the evolution of the net changes in additional taxes and cigarette expenditures, respectively.
Net change in additional taxes
For scenario 1 (constant consumption across income:  ), for the net change in additional taxes to be progressive, the relative price change
r
would need to increase as
), for the net change in additional taxes to be progressive, the relative price change
r
would need to increase as  decreases (in absolute value) (to remain above the beam of curves; figure 2). The beam of curves (blue, purple and red) indicate when the ratio of net taxes divided by income is equal across all income groups (which we call the ‘neutrality’ frontier). Above the curves (‘progressivity’ area), the ratio will increase with income increasing; below (‘regressivity’ area), it will decrease with income increasing.

Neutrality frontier (blue, purple or red): relative price increase (
r
) as a function of price elasticity of demand for the poorest individuals ( ) for different values of the initial tax share within the retail price
  (0=blue (top), 0.30=purple (middle), 0.60=red (bottom)) for which the ratio of net taxes with income is equal across all income groups. Note: the vertical black lines (at
  and
and  ) delimit a plausible range of price elasticity estimates for the poorest individuals (see estimates from table 2). The bottom-right pink-shaded area indicates a (
 ) parameter space for which the net change in taxes will always be regressive (for an initial tax share within the retail price of
  ). The purple points display three combinations of the (
 ;
r
) parameters ({−1.50; 0.37}, {−1.00; 0.70} and {−0.50; 1.70}) located on the neutrality frontier when the initial tax share within the retail price is
;
r
) parameters ({−1.50; 0.37}, {−1.00; 0.70} and {−0.50; 1.70}) located on the neutrality frontier when the initial tax share within the retail price is  (purple curve).
For example, according to the purple curve (figure 2): when  and
and  (at least a 37% price increase), when
  and
and  or when
  and
and  , then the net change in taxes would be progressive (these
  and r estimates (−1.50 and 0.37; −1.00 and 0.70; −0.50 and 1.70) are for an initial tax share t
1=0.30 (30%) within the retail price (neutrality frontier marked by the purple curve on figure 2)). This means that progressivity in net taxes would be obtained as long as
and r estimates (−1.50 and 0.37; −1.00 and 0.70; −0.50 and 1.70) are for an initial tax share t
1=0.30 (30%) within the retail price (neutrality frontier marked by the purple curve on figure 2)). This means that progressivity in net taxes would be obtained as long as  and
r
are sufficiently large (spanning the parameter space above the beam of curves), and this progressivity would be mitigated by the initial tax share
and
r
are sufficiently large (spanning the parameter space above the beam of curves), and this progressivity would be mitigated by the initial tax share  within the retail price: a higher
  would require lower neutrality frontier values for
  and
r
(shift from blue to purple to red curve). The bottom-right pink-shaded area indicates the parameter space of
and
r
(shift from blue to purple to red curve). The bottom-right pink-shaded area indicates the parameter space of  and
r
for which net taxes would be regressive with
and
r
for which net taxes would be regressive with  . With a null initial tax share
  , when price elasticity among the poorest
  equals −1.00, reaching the neutrality frontier would require a 100% relative price change (
 ); with
  , when
  , it would require
  ; and with
  , when
  , it would require
  . Where initial levels of taxes (
 ) are low, larger increases in retail price are necessary to yield progressivity in net taxes.
In scenario 2, when total cigarette consumption varies across income ( ), the net taxes would be progressive as long as two conditions are fulfilled. First, consistent with scenario 1,
  and
r
would need to be sufficiently large (same condition as described above; figure 2): for example,
and
r
would need to be sufficiently large (same condition as described above; figure 2): for example,  (elasticity among the poorest of −1.00) and
  (price increase of 60%) would fulfil this first condition (with
  ). Second, provided the former condition is realised, the income gradient in price elasticity (
 , from poorest to richest) and the income gradient in cigarette consumption (
 , from poorest to richest) would need to evolve within a certain parameter space.
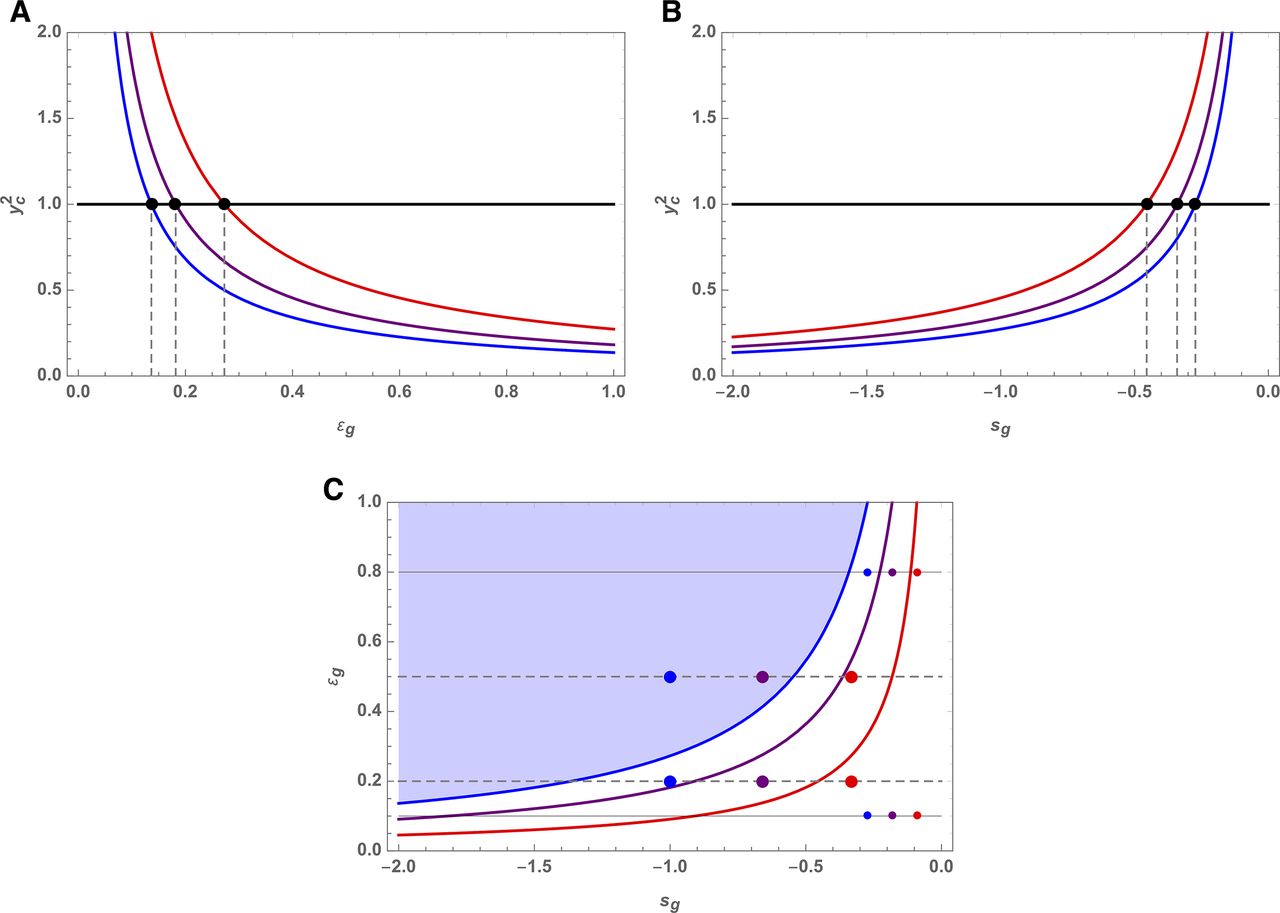
For instance, take  ,
,  ,
,  and cigarette consumption among the poorest of
  (equivalent to smoking prevalence of 30% and daily consumption of 10 cigarettes). When consumption gradients
  (eg, corresponding to prevalence spanning from 30% (among the poorest) to 10% (among the richest); blue curve on figure 3a), reaching full progressivity (horizontal black line) would require elasticity gradients
  (range spanning within −1.00 (among the poorest) to −0.86 (among the richest)). When
  (prevalence from 30% to 20%; comparable with gradients in table 2; red curve), reaching full progressivity would require
  (elasticity spanning within −1.00 to −0.73).

Value of the cut-off function  .(A) Varying with income gradient in price elasticity
  (while
  ,
,  ,
,  ,
,  are held constant).(B) Varying with income gradient in cigarette consumption
  (while
  ,
,  ,
,  ,
,  are held constant). Full progressivity, where the ratio of net taxes with income increases with income across all income groups, is obtained when
  . Partial progressivity, when
  and where: the ratio of net taxes with income increases with income for incomes
y
within
and where: the ratio of net taxes with income increases with income for incomes
y
within  ; and the ratio of net taxes with income decreases with income for incomes
y
within
; and the ratio of net taxes with income decreases with income for incomes
y
within  .(C) Full progressivity frontier (blue (top), purple (middle), and red (bottom) curves, where
  ): income gradient in price elasticity (
 ) as a function of income gradient in cigarette consumption (
 ) for which the ratio of net taxes with income increases with income across all income groups.Note: figure parts A and B use the following parameter values: initial tax share
  , price elasticity for the poorest
  , relative price increase
  and total cigarette consumption for the poorest
  (ie, 30% smoking prevalence and 10-cigarette daily consumption). In figure part A,
  varies from −2.0 (blue (bottom), prevalence from 30% to 10% from poorest to richest), −1.5 (purple (middle), from 30% to 15%), to −1.0 (red (top), from 30% to 20%). In figure part B,
  varies from 1.00 (blue (bottom), elasticity span of −1.00 to 0.00, from poorest to richest), 0.80 (purple (middle), span of −1.00 to −0.20) to 0.60 (red (top), span of −1.00 to −0.40). When
  (horizontal black line), the net change in additional taxes will be fully progressive. Figure part C uses the following parameter values:
  ,
,  ,
,  and various values of
  :
:  (blue (top), ie, 30% smoking prevalence and 10-cigarette daily consumption),
  (purple (middle), ie, 20% prevalence and 10-cigarette daily consumption) and
  (red (bottom), ie, 10% prevalence and 10-cigarette daily consumption). The top-left blue-shaded area indicates a (
 ) parameter space for which the net change in taxes will be partially progressive (for
  ). The beam of curves (blue, purple and red) indicate the full progressivity frontier: below the beam of curves, the net change in taxes will be fully progressive; above, it will be partially progressive. The large coloured points (for
  ) display larger consumption gradients (
 ) corresponding to 1.5 times greater consumption among the poorest versus richest; the small coloured points (
 ) display smaller consumption gradients (
 ), that is, 1.1 times greater consumption among the poorest versus richest.
Conversely, when  (elasticity spanning from −1.00 (poorest) to 0.00 (richest); comparable with gradients in table 2; blue curve on figure 3b), reaching full progressivity (horizontal black line) would require
  (prevalence from poorest to richest within 30% to 27%). When
  (elasticity spanning from −1.00 to −0.40; comparable with table 2 gradients; red curve), reaching full progressivity would require
  (prevalence spanning within 30% to 25%).
In sum, when gradients in cigarette consumption ( ) are large (say 1.5 times greater consumption among the poorest than the richest; see large coloured points on figure 3c), gradients in price elasticity (
 ) need to be smaller (see 0.20 vs 0.50 points) for net taxes to be fully progressive. Conversely, when
  gradients are small (say 1.1 times greater consumption among poorest; see small coloured points on figure 3c),
  gradients can be either small or large (see 0.10 and 0.80 points) for net taxes to be fully progressive. Otherwise, net taxes will only be partially progressive within a certain subgroup of incomes (from
  (poorest) until a cut-off normalised income
  ).
).
Net change in cigarette expenditures
We now turn to net cigarette expenditures, which captures the net financial burden borne (observed) by individuals. In scenario 1, constant consumption across income ( ), figure 4 shows the relationship between relative price increase (
r
) and price elasticity for the poorest individuals (
), figure 4 shows the relationship between relative price increase (
r
) and price elasticity for the poorest individuals ( ) for which the ratio of net expenditures divided by income is equal across income (which we call the neutrality frontier). As
  increases,
r
would need to increase (to remain above the red curve) so that net expenditures are progressive: for example, to increase from
increases,
r
would need to increase (to remain above the red curve) so that net expenditures are progressive: for example, to increase from  when
when  , to
, to  when
when  , and to
  when
when  . Progressivity would require sufficiently high price elasticity (large absolute
  values): for instance, for
  ,
,  would need to be
  so that net cigarette expenditures are progressive.

Neutrality frontier (red curve including blue points): relative price increase (
r
) as a function of price elasticity of demand for the poorest ( ) for which the ratio of net cigarette expenditures with income is equal across all income groups. Note: the vertical black lines (at
  and
and  ) delimit a plausible range of price elasticity estimates for the poorest (see estimates from table 2). The bottom-right pink-shaded area indicates a (
 ) parameter space for which the net change in cigarette expenditures will always be regressive. The horizontal purple points display four combinations of the (
 ;
r
) parameters (all for a relative price increase
;
r
) parameters (all for a relative price increase  ): {−0.90; 0.50}, {−0.70; 0.50}, {−0.50; 0.50} and {−0.30; 0.50}. For {−0.90; 0.50}, {−0.70; 0.50}, the net cigarette expenditures will be progressive (beyond pink-shaded area), while for {−0.50; 0.50} and {−0.30; 0.50}, the net cigarette expenditures will be regressive (within pink-shaded area).
In scenario 2, when consumption varies across income ( ), the net change in cigarette expenditures will be progressive as long as two conditions are fulfilled. First, consistent with scenario 1,
  and
r
need to be sufficiently large (same condition as above; figure 4): for example, when
and
r
need to be sufficiently large (same condition as above; figure 4): for example, when  and
and  , this first condition is realised. Second, provided this former condition is fulfilled,
  (gradient in elasticity) and
  (gradient in consumption) need to remain within a certain parameter space (figure 5).

Value of the cut-off function  .(A) Varying with income gradient in price elasticity
  (while
  ,
,  ,
,  are held constant).(B) Varying with income gradient in cigarette consumption
  (while
  ,
,  ,
,  are held constant). Full progressivity, where the ratio of net cigarette expenditures with income increases with income across all income groups, is obtained when
  . Partial progressivity, when
  and where: the ratio of net expenditures with income increases with income for incomes
y
within
and where: the ratio of net expenditures with income increases with income for incomes
y
within  ; and the ratio of net expenditures with income decreases with income for incomes
y
within
; and the ratio of net expenditures with income decreases with income for incomes
y
within  .(C) Full progressivity frontier (blue (top), purple (middle) and red (bottom) curves, where
  ): income gradient in price elasticity (
 ) as a function of gradient in cigarette consumption (
 ) for which the ratio of net cigarette expenditures with income increases with income across all income groups.Note: figure parts A and B use the following parameter values: price elasticity for the poorest
  , relative price increase
  , and total cigarette consumption for the poorest
  (ie, 30% smoking prevalence and 10-cigarette daily consumption). In figure part A,
  varies from −2.0 (blue (bottom), prevalence from 30% to 10% from poorest to richest), −1.5 (purple (middle), from 30% to 15%), to −1.0 (red (top), from 30% to 20%). In figure part B,
  varies from 1.00 (blue (bottom), elasticity span of −1.00 to 0.00, from poorest to richest), 0.80 (purple (middle), span of −1.00 to −0.20), to 0.60 (red (top), span of −1.00 to −0.40). When
  (horizontal black line), the net change in cigarette expenditures will be fully progressive. Figure part C uses the following parameter values:
  , and various values of
  :
:  (blue (top), ie, 30% smoking prevalence and 10-cigarette daily consumption),
  (purple (middle), ie, 20% prevalence and 10-cigarette daily consumption) and
  (red (bottom), ie, 10% prevalence and 10-cigarette daily consumption). The top-left blue-shaded area indicates a (
 ) parameter space for which the net change in cigarette expenditures will be partially progressive (when
  ). The beam of curves (blue, purple and red) indicate the full progressivity frontier: below the beam of curves, the net change in expenditures will be fully progressive; above, it will be partially progressive. The large coloured points (for
  ) display larger consumption gradients (
 ) corresponding to 1.5 times greater consumption among the poorest versus richest; the small coloured points (
 ) display smaller consumption gradients (
 ), that is, 1.1 times greater consumption among the poorest versus richest.
For instance, take  ,
,  and
and  (corresponding to smoking prevalence of 30% and daily consumption of 10 cigarettes for the poorest). When consumption gradients
  (smoking prevalence spanning from 30% (among the poorest) to 10% (among the richest); blue curve on figure 5a) reaching full progressivity would require elasiticity gradients
  (elasticity span within −1.00 to −0.44 from poorest to richest; comparable to gradients in table 2). When
  (smoking prevalence spanning from 30% to 15%; purple curve), it would require
  (elasticity span within −1.00 to −0.25; comparable with table 2 gradients).
Conversely, when  (elasticity span of −1.00 (among the poorest) to 0.00 (among the richest); comparable with table 2 gradients; blue curve on figure 5b), reaching full progressivity would require
  (smoking prevalence >19% among the richest). When
  (elasticity span of −1.00 to −0.40; comparable to gradients in table 2; red curve), it would require
  (smoking prevalence >11% among the richest).
In sum, when consumption gradients  are large (say 1.5 times greater among the poorest than the richest; see large coloured points on figure 5c), elasticity gradients
  can span the whole parameter space (from 0.00 to 1.00) and net expenditures will be fully progressive. Likewise, when
  gradients are small (say 1.1 times greater among the poorest; see small coloured points),
  gradients can also span the whole parameter space and net expenditures will be fully progressive. Solely when larger
  gradients (say 2.0 times greater among the poorest) coexist with large
  gradients (within 0.60 to 1.00) (see blue-shaded area on figure 5c), net cigarette expenditures will only be partially progressive within a certain subgroup of incomes (from
  (poorest) to a cut-off normalised income
  ).
).
Instances of progressivity, regressivity and neutrality
We synthesise here our findings by reporting on parameter spaces for which we would observe progressivity, regressivity or neutrality for the net cigarette expenditures.
First, consider when  (figure 4), we would obtain neutrality in net expenditures for the following situations (see blue points on the neutrality frontier):
  ,
,  and
and  . Thus, for
  , the ratio of net expenditures divided by income would be equal (neutral) for
  . When
  , the ratio would be larger for the poorest than for the richest; when
  , the ratio would be smaller for the poorest. Similarly, for
  , the ratio would be neutral for
  . When
  , the ratio would be larger for the poorest; when
  , it would be smaller for the poorest. For
  , neutrality would be obtained for
  . When
  , regressivity would incur; otherwise, progressivity would incur. In sum, for large price hikes (50% and more) and observable elasticity estimates (
 within −1.00 to −0.50; see table 2), net cigarette expenditures would be progressive.
Conversely (examining horizontal purple points on figure 4), when setting price increase  , when
  , progressivity would incur, with potentially net negative expenditures for the poorer (
 ) compared with other income groups (
 ) (recall income was normalised: 0≤y≤1; y=0 and y=1 would define lower (poorest) and higher (richest) incomes, respectively. Therefore, y=0.5 would define median (middle) income; while y=0.1<0.5 would define poorer incomes and y=0.9>0.5 would define richer incomes). When
  , we would still observe progressivity, with a share-income of expenditures 1.8 times greater among the richer (
 ) than the poorer (
 ). However, when
  , we would see regressivity, with a share-income of expenditures 3.2 times greater among the poorer than the richer. Likewise, when
  , we would see a share-income of expenditures 5.6 times greater among the poorer. Lastly, when
  , we would observe regressivity, with a share-income of expenditures 7.9 times greater among the poorer.
Second, consider when  and take
  (elasticity among the poorest) and
  (price increase of 60%). We could observe full progressivity (figure 5; online supplementary webappendix figure S3) for different values of
  ,
,  and
and  (online supplementary webappendix, section 4). The likelihood of progressivity would increase when: values of consumption gradients
  are small (combined with either small or large elasticity gradients
  ); or large values of
  are combined with small values of
  .
.
Third, take selected country case studies (table 3; online supplementary webappendix, section 5), we would see a variety of outcomes. On the one hand, relative price increases of 72% and 100% in the Philippines and Bulgaria, respectively, would lead to progressivity in net cigarette expenditures; on the other hand, price increases of 58%, 29% and 20% in Colombia, Sweden and the UK, respectively, would lead to regressivity in net cigarette expenditures.
If addiction were added to our model, it could affect overall price elasticity of demand. One could envision a fraction of smokers with strong addiction, hence who would not quit or reduce consumption with increased taxation (for each income
y
, which we could denote  ; see online supplementary webappendix, section 6). In this case, if poor smokers were more addicted than rich smokers, progressivity in net expenditures could be impacted proportionally to the relative fraction of addicted smokers among the poor compared with the rich.
Lastly, in the rare cases of settings where smoking prevalence and consumption increase with income (eg, Georgia and Mexico),48 for sufficiently large price increases and price elasticity among lower incomes, net cigarette expenditures would be progressive.
Discussion
We developed a mathematical model to demonstrate the circumstances in which the impacts of additional tobacco taxes are not regressive, using a standard income-share accounting definition of tax burden. Using an accounting definition of tax burden (net expenditures relative to income), we find that increased tobacco taxes are not inherently regressive in consumption. We demonstrated that for sufficiently large price elasticity of demand for tobacco products and large price increases (eg, 50% and more), the distribution in net cigarette expenditures could be progressive. That is, the model shows that when a susbantial price increase (50%–100%) is applied, we can expect a progressive decrease in demand (with ranges in price elasiticity across income groups of between −1.00 and −0.20), which would translate into fewer people smoking with direct implications for improved health outcomes. Such progressivity is conceivable as large price elasticities of demand for tobacco among the poor, and especially among the young, have been observed in many countries (tables 2 and 3), and policies of 50% increases and above in the price of tobacco have been enacted in numerous countries and would be necessary to bring taxation levels up to MPOWER recommendations in many settings.7
Fundamentally, our findings rest on the use of one (among many possible) definition of tax burden: the standard income-share accounting definition.14 Therefore, using other interpretations of tax burden, increased tobacco taxes could well be categorised differently. For example, in spite of progressive increases, an already regressive baseline tobacco tax (before increased taxation) may remain. Also, our income-share accounting ignores individual valuation of consumption changes and associated welfare-based willingness to pay of individuals who may see foregone utility in reduced cigarette consumption. Likewise, income-share accounting does not consider welfare-based time-inconsistent preferences and internalities of individuals who may regard taxes as a commitment device forcing them to quit in the long term, which they cannot realise in the short term.20 In summary, we acknowledge that we approached the question of regressivity of tobacco tax from a standard technical accounting point of view only, even though this question could be scrutinised via multiple economical and philosophical lenses, all of which are subject to controversy.
Our mathematical exploration confirms the fact that in specific circumstances increased tobacco taxes could lead to reductions in the burden of cigarette expenditures borne by individuals, as seen under certain scenarios tested via simulation models.23 In this respect, particularly large tax increases could prevent tobacco taxes from being regressive in terms of consumption and net cigarette expenditures. This is in addition to large tax increases leading to broader health benefits (reduction in premature mortality and morbidity) and financial risk protection benefits (reduction of impoverishment related to tobacco-related disease care and work productivity losses).21 Furthermore, revenues raised via tobacco tax hikes could be redistributed progressively to lower income populations.
Nevertheless, our model presents a number of limitations. First, we have made a number of simplifications in the parameter selection, such as the monotonous nature of some of the inputs, for ease of interpretation. However, this would not affect the generalisability of our findings. Second, we examined regressivity in consumption across income groups at the population level and did not examine regressivity within the individuals who continue smoking or those individuals who quit smoking. Evidently, as rightly pointed by Remler,14 in the absence of other demand-side measures, any individual with inelastic demand (which would include those smokers most addicted) would be economically burdened. Consequently, for the subset of persons across income groups who are price inelastic and continue smoking, increased tobacco taxes will always be regressive.14 For instance, poorer individuals who do not quit or reduce consumption would be financially harmed. When a greater proportion of those most addicted exists among lower (vs higher) income groups, regressivity could be enhanced proportionally with the relatively greater fraction of addicted among lower income groups. This can be observed in terms of reduced overall price elasticity among lower income groups, thus reduced variation in price elasticity across income groups.56 Yet, in the absence of empirical data on the distribution of addiction levels among smokers of different incomes, such disaggregated analyses remain difficult to implement. Overall, this underscores the importance of implementing tax policy within a broad framework of demand-side measures, particularly those that reduce the burden of addiction associated with socioeconomic deprivation. Third, we used a static model, which assumes immediate impact of the tax on consumption and did not look at transition periods. For example, we did not consider the ‘stage’ of the cigarette epidemic on a per-country basis,57 the prevalence of smoking or factors that are associated with future cessation, such as social acceptability of smoking, health communications and smoke-free laws.58 Neither did we examine long-term net impacts of increased taxes (eg, reduction in future tobacco-related medical costs and associated catastrophic expenditures; use of new fiscal revenues to roll-out interventions promoting equity), which could further improve progressivity.24 Fourth, our model did not account for the variety in cigarette brands consumed differentially across income groups. As lower income individuals would consume cheaper brands, increased taxes would likely have a larger impact on the price of cheap (vs expensive) cigarettes, thus contributing to a greater price response among lower income groups and enhancing tax progressivity. This could also occur in the (rare) instances where smoking consumption increases with income (eg, Georgia and Mexico).48 Lastly, as we used an accounting definition of tax burden, our model would not capture welfare dimensions of taxation (willingness to pay for foregone cigarettes, time-inconsisent preferences and internalities), estimations of deadweight losses and losses of consumer surpluses among lower income individuals no longer consuming tobacco that they would value otherwise, all of which could enhance regressivity.14 33
However, while relaxing the inherent regressivity of tobacco taxes (from a standard accounting viewpoint), our analysis supports the importance of increased tobacco taxes in reducing demand for smoking, and thus comprising a critical strategy in curbing the predicted tobacco death toll for the 21st century.59 In particular, specific excise taxes that narrow the gap between cheaper and more expensive cigarettes are still underused globally,4 especially in emerging economies where they could prevent a burgeoning epidemic.
Finally, tobacco taxes are just one type of ‘sin tax’, like taxes on alcohol, fats and sugary drinks, where arguments for regressivity have hampered broad adoption. Our analysis furthers the case for implementation of large increases in tobacco taxation: in addition to being life saving, revenue raising and progressive in the totality of their effects, we show that under certain circumstances and when appropriately targeted to subpopulations with disparate rates of smoking, tobacco excise taxes need not be inherently regressive in consumption.
What this paper adds?
Tobacco taxes are often considered regressive, undermining efforts to fully implement them at levels recommended by WHO.
We point to a set of circumstances in which increased tobacco taxation should not be considered to penalise the poorest income groups, using a standard income-share accounting definition of tax burden when examining marginal cigarette consumption expenditures.
Our findings question the doctrine that tobacco taxes are uniformly regressive from a standard income-share accounting view.
Data availability statement
All data relevant to the study are included in the article or uploaded as supplementary information.
References
Footnotes
Presented at Earlier versions of this paper were presented during seminars at the Harvard T.H. Chan School of Public Health and the Centre for the Evaluation of Value and Risk in Health, Tufts Medical Centre, where we received valuable comments from seminar participants. We are indebted to three anonymous reviewers for constructive and helpful comments on an earlier version of the manuscript.
Contributors SV conceived and designed the study. SV conducted the analysis with inputs from VWR amd PKAK. SV wrote the first draft of the manuscript, which VWR and PKAK reviewed and edited.
Funding The authors have not declared a specific grant for this research from any funding agency in the public, commercial or not-for-profit sectors.
Competing interests None declared.
Provenance and peer review Not commissioned; externally peer reviewed.