Article Text

Abstract
Background We revisited the association between progress in MPOWER implementation from 2008 to 2016 and smoking prevalence from 2009 to 2017 and offered an in-depth understanding of differential outcomes for various country groups.
Methods We used data from six rounds of the WHO Reports on the Global Tobacco Epidemic and calculated a composite MPOWER Score for each country in each period. We categorised the countries in four initial conditions based on their tobacco control preparedness measured by MPOWER score in 2008 and smoking burden measured by age-adjusted adult daily smoking prevalence in 2006: (1) High MPOWER – high prevalence (HM-HP). (2) High MPOWER – low prevalence (HM-LP). (3) Low MPOWER – high prevalence (LM-HP). (4) Low MPOWER – low prevalence (LM-LP). We estimated the association of age-adjusted adult daily smoking prevalence with MPOWER Score and cigarette tax rates using two-way fixed-effects panel regression models including both year and country fixed effects.
Results A unit increase of the MPOWER Score was associated with 0.39 and 0.50 percentage points decrease in adult daily smoking prevalence for HM-HP and HM-LP countries, respectively. When tax rate was controlled for separately from MPOWE, an increase in tax rate showed a negative association with daily smoking prevalence for HM-HP and LM-LP countries, while the MPOWE Score showed a negative association for all initial condition country groups except for LM-LP countries.
Conclusion A decade after the introduction of the WHO MPOWER package, we observed that the countries with higher initial tobacco control preparedness and higher smoking burden were able to reduce the adult daily smoking prevalence significantly.
- WHO MPOWER Measures
- Smoking Prevalence
- Global tobacco epidemic
- MPOWER Score
- implementation of MPOWER package
Data availability statement
Data are available in a public, open access repository. We used data from the six rounds of the WHO Reports on the Global Tobacco Epidemic, available at https://www.who.int/tobacco/mpower/en/
This is an open access article distributed in accordance with the Creative Commons Attribution Non Commercial (CC BY-NC 4.0) license, which permits others to distribute, remix, adapt, build upon this work non-commercially, and license their derivative works on different terms, provided the original work is properly cited, appropriate credit is given, any changes made indicated, and the use is non-commercial. See: http://creativecommons.org/licenses/by-nc/4.0/.
Statistics from Altmetric.com
- WHO MPOWER Measures
- Smoking Prevalence
- Global tobacco epidemic
- MPOWER Score
- implementation of MPOWER package
Introduction
In 2008, the WHO introduced the ‘MPOWER’ package, comprised of best-practice cost-effective interventions outlined in the WHO Framework Convention on Tobacco Control (WHO FCTC), to assist in the country-level implementation of effective practices to reduce the demand for tobacco.1 2 The MPOWER package consists of six intervention categories: M: monitor tobacco use; P: protect people from tobacco smoke; O: offer help to quit tobacco use; W: warn about the dangers of tobacco; E: enforce bans on tobacco advertising and promotion; R: raise taxes on tobacco products.1 WHO has systematically tracked and reported the extent of country-level implementation of the six MPOWER categories in the WHO Reports on the Global Tobacco Epidemic.1 3–8
One strand of studies employed ex ante projection models to predict the expected impact of MPOWER implementation on tobacco smoking.9–11 A second strand of studies investigated the association between varying levels of MPOWER implementation and smoking prevalence.12–16 However, at the initial stages of MPOWER roll-outs, smoking prevalence and existing tobacco control policy infrastructure were heterogeneous across countries. The existing literature does not explore how the association between MPOWER intervention implementation and smoking prevalence differs for countries with different initial conditions. We revisited the role of MPOWER implementation in smoking prevalence using implementation data from 2008 to 2016 and prevalence data from 2009 to 2017 to evaluate global MPOWER policies considering differential impacts for various categories of countries, based on their initial tobacco control preparedness and initial smoking burden.
Among MPOWER measures, tobacco taxation (R) is often highlighted as the most effective.17 Due to its large impact, low implementation cost and contribution in increasing government revenues that can potentially expand health sector funding, WHO classifies countries where total taxes represent 75% or more of the retail price of a pack of cigarettes as countries at the highest level of achievement. Yet, R is the least implemented measure among all. In 2018, the share of the world population covered by specific MPOWER measures at the highest level of achievement was 14% for taxation, 52% for pack warnings, 38% for monitoring, 32% for cessation programmes, 24% for mass media campaigns, 22% for smoke-free policies and 18% for advertising bans.8 Tobacco taxation is most effective when implemented as part of a comprehensive tobacco control programme that includes other measures as well. R and MPOWE can, therefore, be viewed as mutually reinforcing. The association of smoking prevalence with tobacco control measures across these two (MPOWE and R) dimensions is, therefore, important to highlight.
In this paper we explored how smoking prevalence and MPOWER implementation evolved in countries with different initial smoking burden and tobacco control preparedness. Further, we analysed smoking prevalence in relation to fiscal (ie, R), and non-fiscal intervention components of tobacco control (ie, MPOWE).
Methods
Data and measures
We used age-standardised prevalence rates for adult daily smokers of tobacco (weighted by sex) for the years 2006, 2009, 2011, 2013, 2015 and 2017 and the summary scores for MPOWER measures for the years 2008, 2010, 2012, 2014, and 2016, respectively, from the six rounds of the WHO reports on the Global Tobacco Epidemic.1 3–8 The prevalence data prior to 2017 is taken from original versions of the WHO Report on the Global Tobacco Epidemic and does not take into account potential retroactive corrections made on prevalence estimates in 2019.
WHO reports country positions in terms of attaining certain levels of implementation of MPOWER measures (online supplementary appendix table A1), ensuring consistency and comparability across countries and over time. There are four attainment levels for M and five attainment levels for each of the other components. The W component has two parts—health warnings and mass media, each with five attainment levels. Countries are scored for each component based on their attainment level of that component. The lowest attainment level is scored as 1, and the highest attainment level is scored as 4 for M and 5 for other components. We aggregated the individual component scores to calculate a composite MPOWER Score for a country. Since we have seven MPOWER categories, the minimum MPOWER Score is 7, and the maximum achievable MPOWER score is 4 + (5×6) or 34. In our analysis, additionally, we used MPOWE Scores, that is, MPOWER Score excluding the taxation component R, which ranges from a minimum of 6 to a maximum of 29.
Supplemental material
The composite MPOWER and MPOWE Scores should be interpreted with caution. A high score generally indicates attaining higher levels of tobacco control in the country. But the aggregate scores could not differentiate the relative importance of different MPOWER components (eg, higher attainment of M and lower attainment of P, and vice versa), or different level of changes within a component (eg, moving from 1 to 2 as opposed to moving from 3 to 4). Also, different measures may have different latencies in demonstrating an impact. Notwithstanding, aggregating MPOWER Scores is useful in generating a consistent ranking of implementation status across countries and over time, and in analysing trend relationships.16
We categorised countries in four groups based on their position above or below the median with respect to two initial conditions: tobacco control preparedness (measured by MPOWER Score in 2008) and smoking burden (measured by adult daily smoking prevalence in 2006) reported in the WHO report on the global tobacco epidemic 2009. A country is defined as ‘high MPOWER’ if the country’s MPOWER Score in 2008 was above the median score (ie, 20), and ‘low MPOWER’ otherwise. A country is defined as ‘high prevalence’ if the country’s adult smoking prevalence in 2006 was greater than the median (ie, 19.5%) and ‘low prevalence’ otherwise. The four categories are (1) High MPOWER – high prevalence (HM-HP). (2) High MPOWER – low prevalence (HM-LP). (3) Low MPOWER – low prevalence (LM-LP). (4) Low MPOWER – high prevalence (LM-HP).
Empirical approach
First, we summarised the changes in adult (age-standardised) smoking prevalence from 2009 to 2017 obtained from the 2011 and 2019 WHO reports, respectively, and MPOWER scores from 2008 and 2016 obtained from the 2009 and 2017 WHO reports, respectively. Next, we measured the associations between changes in MPOWER score and smoking prevalence using two-way fixed-effects panel regression specifications, as in equations 1, 2, and 3.
 (1)
(1)
 (2)
(2)
 (3)
(3)
Where, Prevalenceit is the age-standardised adult daily smoking prevalence in country i at period (year) t; MPOWERi,t-1 is country i's MPOWER score at period t-1. The lag score is introduced to allow for impact transmission in period t. It also addresses the issue of simultaneity, that is, countries with lower smoking rates are likely to demonstrate a lower degree of tobacco control initiative, which would be reflected in lower contemporaneous MPOWER scores. Use of lag scores beyond 1 year leads to loss of substantial number of observations and statistical power. Initialj,i is a binary variable that denotes country i’s initial condition j described above. WBGg,i is another binary variable indicating the World Bank country income classification g of country i. The association between progress in MPOWER implementation in period t-1 and adult smoking prevalence in period t is captured by the coefficient β1 for all countries, β1j for the country group having jth type initial condition (eg, HM-HP, HM-LP, LM-LP or LM-HP), and β1g for the country group of gth type World Bank income classification (eg, low-income countries and lower-middle income countries: LIC and LMIC; or high-income countries and upper-middle-income countries: HIC and UMIC). Countryi and Yeart are country fixed-effects and year fixed-effects, respectively. The fixed-effects for each country control for the unobserved omitted variables that are constant over time but differ across countries and time fixed-effects control for variables that do not vary across countries but evolve over time. Lastly, εit is the idiosyncratic error term. Errors are clustered at the WHO region—initial condition level (eg, for the African region: AFR - HM-HP, AFR - HM-LP, AFR - LM-LP, AFR - LM-HP, etc).
We used five rounds of data on adult smoking prevalence reported in 2-year intervals, that is, t=2009, 2011, 2013, 2015, 2017 and corresponding MPOWER Scores at period t-1 refers to the value from the immediate previous round (ie, 2008, 2010, 2012, 2014, 2016). Regressions were run for 117 countries based on data availability (online supplementary appendix table A2); no systematic pattern of dropping out by country economic category was observed.
Supplemental material
Next, we analysed the association between adult smoking prevalence and cigarette tax rates using the following specifications:
 (4)
(4)
 (5)
(5)
 (6)
(6)
Where Taxi,t-1 is the cigarette tax rate as the percentage of the retail price of the most sold cigarette brand obtained from the WHO Reports in country i at period t-1 (ie, 2008, 2010, 2012, 2014, 2016). Instead of using the score of R, we used the continuous variable cigarette tax rates as in Equations 4, 5, and 6. The tax data comprise specific excise taxes, ad valorem excise taxes, value added or sales taxes, import duties and other taxes. To isolate the association of smoking prevalence with MPOWE and R, we estimated Equations 7, 8, and 9.
 (7)
(7)
 (8)
(8)
 (9)
(9)
Where MPOWEi,t-1 is the MPOWE Score (ie, MPOWER Score excluding R) in country i at period t-1 and Taxi,t-1 is the cigarette tax rate in country i at period t-1. The coefficients ρ and π, respectively, measure the association between smoking prevalence and MPOWE holding tax rate constant, and the association between smoking prevalence and tax rate holding MPOWE level constant for corresponding country group. Estimates of ρ and π can provide some relative measure of the degree of association between change in smoking prevalence and the two types (fiscal and non-fiscal) of tobacco control policies. For example, if for a certain country group, the expected value of π, conditional on MPOWE Score, is negative and statistically significant, it means given the level of MPOWE implementation, an increase in cigarette tax rate is associated with a decrease in adult smoking prevalence in that country group. Similarly, a negative and significant estimate of ρ, conditional on cigarette tax rate suggests, given the level of cigarette tax rate, an increase in MPOWE Score is associated with a decrease in smoking prevalence. If the estimate of ρ is significant, and the estimate of π is not, then it refers to the case where the association of smoking prevalence with non-fiscal tobacco control measures (ie, MPOWE) is more discernible than the association with fiscal intervention (ie, increase in cigarette tax rate), and vice versa.
Even though tax-induced price increases lead to reduction in demand, income growth induces increase in demand that can partially or fully offset the reduction in demand. The net effect on demand is, thus, determined by the changes in both price and income which in turn determine the affordability of a product. We therefore checked the robustness of our results by controlling for an affordability measure (percentage of GDP per capita required to purchase 2000 cigarettes of the most sold brand obtained from the WHO Reports on the Global Tobacco Epidemic) in the model. We also checked the sensitivity of our analysis by pulling out one individual component of MPOWE at a time and analysing the relationship between smoking prevalence and the remaining components. It allowed us to distinguish between the effects of individual demand reduction measures.
Results
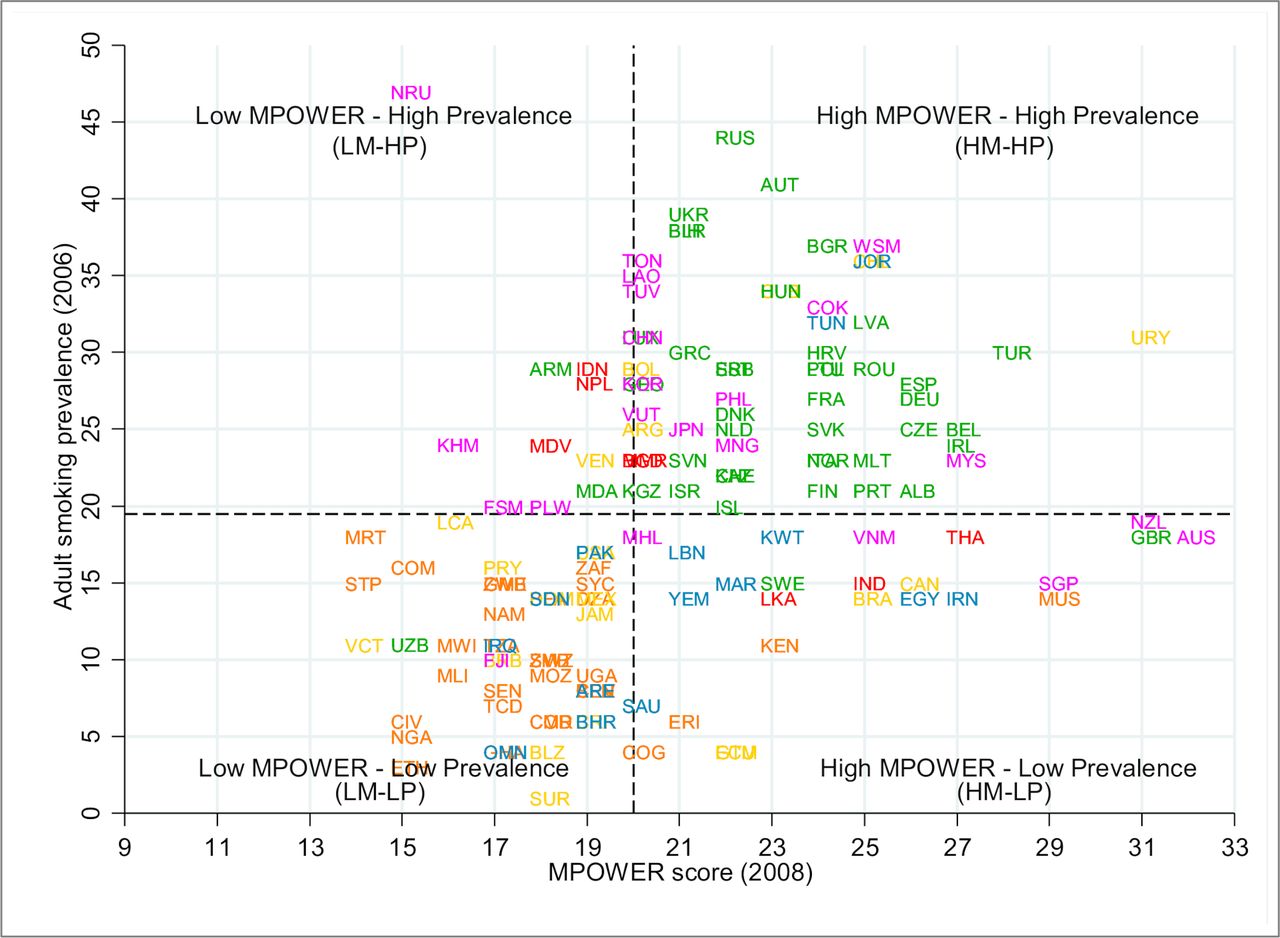
Figure 1 shows the distribution of countries in four categories by initial preparedness and adult smoking burden. Our sample consists of the countries for which, at the least, smoking prevalence for the years 2009 and 2017, and MPOWER scores and tax rates for the years 2008 and 2016 are available. There are 43 countries in the HM-HP group, the majority (80%) of which are from the WHO European (EUR) region. More than 60% of the 37 countries in the LM-LP group are from the WHO African (AFR) region. In the LM-HP group, about 50% of the 18 countries are from the WHO Western Pacific (WPR) region. The majority (90%) of the countries in the HM-HP category are HICs and UMICs. Nearly 60% of the countries in the LM-LP category are LICs and LMICs. In the LM-HP group, more than 60% of the countries are LIC and LMIC. In general, nearly two-thirds of the high initial smoking burden countries (HP) are HIC and UMIC and 52% of the low initial smoking burden countries (LP) are LIC and LMIC. More than 80% of the better-prepared countries (HM) are HIC and UMIC and around 60% of the least prepared countries (LM) are LIC and LMIC. Online supplementary appendix table A2 provides details on the country codes and categories.

Countries by initial conditions of adult daily smoking prevalence and MPOWER Score note: Three-digit country codes are used in the scatter plot (online supplementary appendix table A2). The horizontal and the vertical dashed-lines indicate the median adult daily smoking prevalence (19.5%) and the median MPOWER Score (20), respectively, and the intersection of these two lines creates four quadrants indicating four country categories (ie, HM-HP, HM-LP, LM-LP, LM-HP). Country observations are color-coded by who regions—Africa is orange, the Americas is gold, Eastern Mediterranean is blue, Europe is green, South-East Asia is red and Western Pacific is magenta.
Table 1 reports the summary statistics of the composite MPOWER Score, the MPOWE Score, cigarette tax rate and adult smoking prevalence by initial country conditions. The average MPOWER and MPOWE Scores increased by around 4 points from 2008 to 2016. The largest average increase (6.6 points) was for the LM-HP country group, indicating that countries with high prevalence in 2008 but low MPOWER Scores registered greater improvements in the MPOWER Scores over time. The average tax rate increase from 2008 to 2016 was also the highest (11.5 percentage points) for the LM-HP group. The changes in average tax rate for the HM-LP and LM-LP groups were very small (−0.1 to 1.2 percentage points) and 5.7 percentage points for the HM-HP group. The decrease in average adult daily smoking prevalence is the largest (4.1 percentage points) for the HM-HP group, followed by nearly 3 percentage points average decrease for the HM-LP and LM-HP groups. The LM-LP group experienced the least decrease in average smoking prevalence (0.4 percentage points).
Summary statistics by country initial conditions
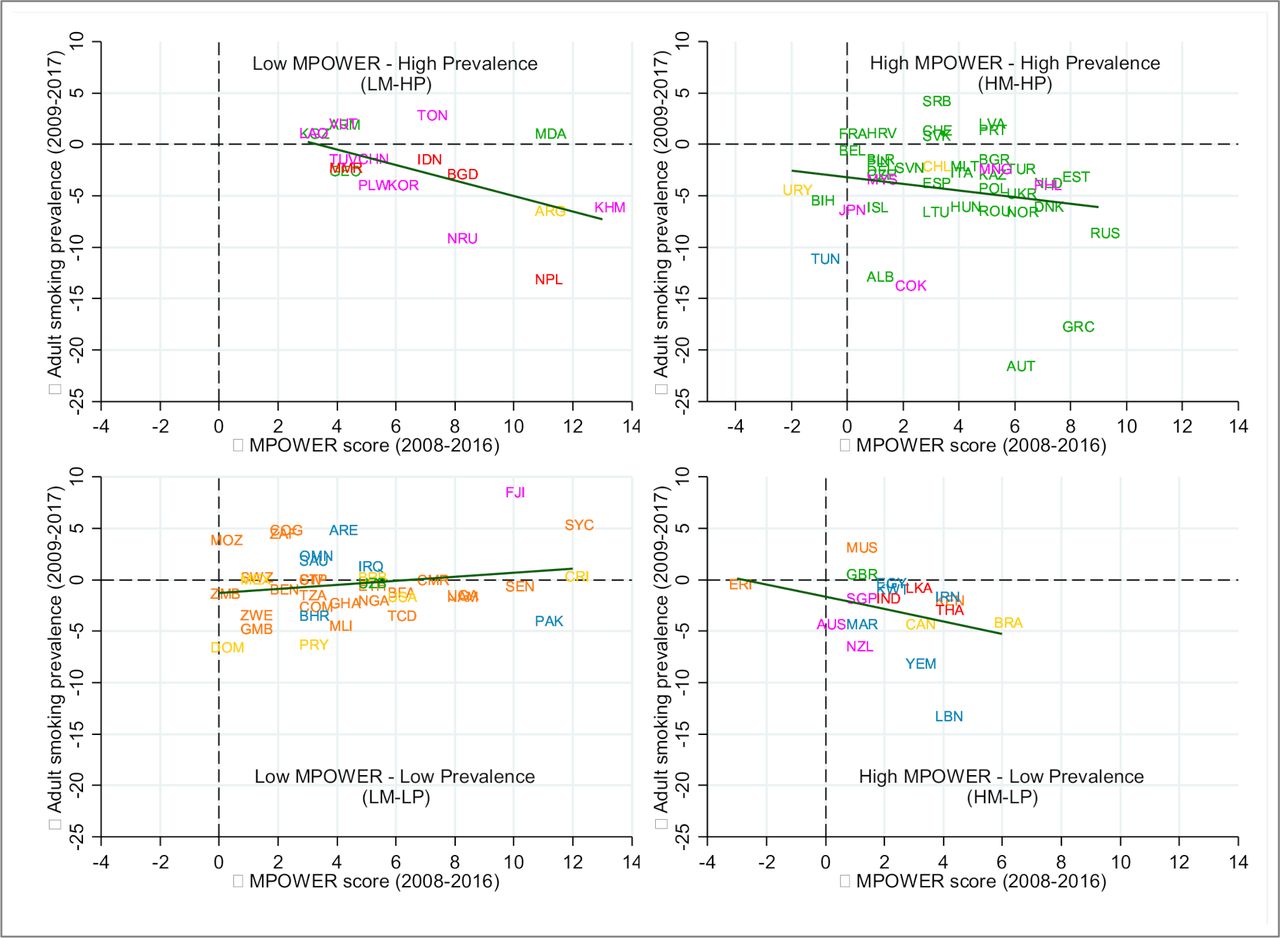
Figure 2 indicates the degree of association between progress in MPOWER and change in adult smoking prevalence across four country groups. The linear fitted lines for the HM-HP, HM-LP, LM-HP country groups suggest a negative (unadjusted) association between progress in MPOWER and change in adult smoking prevalence. The slightly upward fitted line for the LM-LP group suggests a potential positive association between MPOWER progress and smoking prevalence.

Change in MPOWER Score (2008 to 2016) and change in adult daily smoking prevalence (2009 to 2017) by initial condition note: observations are color-coded by who regions—Africa is orange, the Americas is gold, Eastern Mediterranean is blue, Europe is green, South-East Asia is red, and Western Pacific is magenta. The straight line is the linear fitted line for each initial condition group.
The unadjusted associations observed in figure 2 were empirically examined using two-way panel fixed-effects regressions. We estimated equations 1, 4, and 7 to quantify the association of adult daily smoking prevalence with MPOWER Score, tax rate, and MPOWE score and tax rate, respectively, for all countries in the sample (table 2). The association between MPOWER Score and adult daily smoking prevalence was negative though not significant. The association was not significant for the MPOWE Score as well when we controlled for tax rate in the model. On the other hand, the association between adult daily smoking prevalence and the tax rate was negative and significant in both specifications (ie, tax rate alone and tax rate with MPOWE Score). Our estimates suggest that one percentage point increase in cigarette tax rate is associated with a 0.05 percentage point decrease in age-standardised adult daily smoking prevalence.
Regression results: all countries
Next, we estimated equations 2, 5, and 8 to examine the associations across country groups by initial tobacco control preparedness and initial smoking burden. Results (table 3) show negative associations in countries where initial tobacco control preparedness was high. A unit increase of the MPOWER composite score was associated with 0.39 and 0.50 percentage points reduction in age-standardised adult daily smoking prevalence for HM-HP and HM-LP countries, respectively. Conversely, positive or insignificant associations were observed for countries where initial tobacco control preparedness was low. The associations with tax rate were negative and significant for the HM-HP and LM-LP countries and insignificant for the HM-LP and LM-HP countries. When tax rates were controlled for in the model, the association between smoking prevalence and MPOWE Score was negative and significant for the HM-HP, HM-LP and LM-HP countries. The association with tax rate, controlling for MPOWE Scores, was negative and significant for HM-HP and LM-LP countries. The association was insignificant for the HM-LP and LM-HP countries.
Regression results by initial conditions
Lastly, we estimated equations 3, 6, and 9 to examine the associations across the World Bank country income classifications (online supplementary appendix table A3). Though the signs of the coefficient estimates representing association of smoking prevalence with MPOWER and MPOWE Scores were negative in all specifications, none of the estimates were statistically significant. The association between the tax rate and adult daily smoking prevalence was negative and significant for the World Bank UMICs and HICs in both specifications, and not statistically different from zero for the LICs and LMICs. For the UMICs and HICs, one percentage point increase in the cigarette tax rate was associated with a 0.07 percentage point decrease in age-standardised adult smoking prevalence.
Supplemental material
Discussion
Between 2008 and 2016 MPOWER Scores improved for most countries, and smoking prevalence declined. When countries are categorised by initial tobacco control preparedness and initial smoking burden, we find a negative association between adult daily smoking prevalence and the progress in MPOWER implementation in countries with high initial preparedness, and in countries with low preparedness and high initial burden.
Previous studies that employed ex ante projection models to quantify the impact of MPOWER implementation on tobacco smoking asserted negative associations.9–11 Levy et al estimated 22 million fewer projected smoking-attributable deaths, from 88 countries adopting at least one highest level MPOWER policy between 2007 and 2014.11 Dubray et al assessed the effect of varying levels of MPOWER Scores on smoking prevalence for the period 2006 to 2009 and found a negative association of smoking prevalence with M and R scores.12 In a similar vein, Gravely et al found a significant association between the decrease in smoking prevalence between 2005 and 2015 and the highest-level implementations of MPOWER measures between 2007 and 2014.13 However, by focusing on the effect of the highest-level policy implementation, Gravely et al potentially obscured the effect of less than the highest level implementation of the MPOWER package.14
A negative relationship between the 2010 policy score and the change in smoking prevalence from 2010 to 2015 was also asserted by Anderson et al.15 Ngo et al estimated a 0.2 percentage point decrease in prevalence among adults due to a 1-unit increase in MPOWER composite score.16 However, a recent study by Hoffman et al finds no evidence of a significant association between FCTC measures and cigarette consumption.18 Mukherjee and Ekanayake report a weak relationship between smoking prevalence and taxation.19 Though they use the tax rates and control for MPOWE measures, their methods are different from ours in several ways. First, they do not consider any lag in MPOWER measure’s impact on smoking prevalence. Second, they separately control for each MPOWE policy variable that is subject to a high degree of multicollinearity. Third, they do not control for year fixed effects. Our analytical approach based on initial preparedness and smoking burden provides a more nuanced understanding of the relationship between MPOWER implementation and smoking prevalence.
Among the MPOWER components, the improvement mainly occurred in average MPOWE achievement level score that varied from the increment of 2–6 units on average for different country groups. Average change in cigarette taxation, on the other hand, was around 1 percentage point or lower for the countries with low initial prevalence, but 5–13 percentage points for countries with high initial prevalence. The level of average cigarette tax rates also shows a huge variation, ranging from the high 30s to low 70s, across these country groups. Given such heterogeneity across countries, the joint analysis of the non-fiscal tobacco control measures (ie, MPOWE) and fiscal measure (ie, R) is important. This aspect remained unexplored in previous studies. To this effect, our findings indicate heterogeneous responsiveness of fiscal and non-fiscal tobacco control measures to adult smoking prevalence across different country groups.
We observe a positive association between progress in MPOWER implementation and adult daily smoking prevalence in the LM-LP countries. Most of these are African nations, where tobacco industry interference could be intense to expand its market in these low prevalence countries. Another potential explanation could be that the progress in countries with a low MPOWER Score has not been enough to impart impact on the low prevalence rates. Also, countries may differ by changes in social unacceptability of smoking or relative changes in smoking across groups within a country. As a sensitivity check we estimated a model with country-specific linear time trends to account for country-specific heterogeneity that changes at a constant rate over time; the results (online supplementary appendix table A4) remained largely similar to the original estimates. Adult daily smoking prevalence was negatively associated with tax rate for the LM-LP countries and with MPOWE for the HM-HP and HM-LP countries.
Supplemental material
This analysis has some limitations. We used the WHO reported age-standardised prevalence rates for adult daily smokers. We could not analyse whether and how non-daily smoking has changed over time. There could be reporting issues in the WHO data; validating the compliance and the reported degree of implementation of MPOWER measures is beyond the scope of this study. The study period of 10 years may be relatively short for analysing tobacco control policies in many countries.
The WHO did not report W2 scores for the year 2008. We imputed W2 measures for a country in 2008 by taking the minimum of the reported W2 score for that country in the subsequent years (2010, 2012 and 2014). New and emerging tobacco and nicotine products such as heated tobacco products (HTPs) and e-cigarettes were not included while estimating smoking prevalence data. Also, we did not analyse smokeless tobacco consumption, which is a concern in many countries with major implementation gaps in smokeless tobacco control policies.20
Our analysis does not control for price, which in combination with income is a major determinant of people’s decision to smoke. As a robustness check, we included affordability of the most sold brand of cigarettes, measured by the percentage of gross domestic product (GDP) per capita required to purchase 2000 cigarettes of the most sold brand, in the model, but the main results remained largely unchanged. There could be differences in the relationship between retail prices and tax rates across poor and rich countries, which is beyond the scope of this paper. Nargis et al examine the dichotomy of low price-high tax share; however, more country-specific studies are required to draw a line between poorer and richer countries showing a systematic relationship between retail price and tax rate.21
The effectiveness of increasing taxes in reducing tobacco use depends significantly, among others, on whether a tax increase can induce price increases. A tax increase can be undershifted or absorbed by the tobacco industry and may fall short of generating the desirable outcome. Notwithstanding, the tax share in retail price is a strong indicator of the strength of a tax increase to induce increases in price and to have relative cigarette prices to induce consumption reduction. When the tax share is lower, industry has more room to absorb a tax increase and to keep lower relative prices compared with a high tax share scenario. Tax shares can therefore be treated as performance metrics of tax policy implementation and relative cigarette prices. The country fixed effects also take in to account the across-country variations in cigarette prices.
Our aggregation scheme to obtain composite MPOWER and MPOWE Scores assigns equal weight to each indicator irrespective of their effectiveness as a tobacco control measure. Different combinations of measures with different strengths could have a differential impact in reducing smoking prevalence and our measure is limited in capturing this variation. To check the robustness of our measure, we constructed an index using the linear combination of the first principal component of MPOWER Scores. However, the MPOWER and MPOWE Scores using principal component analysis (PCA) weights shows a strong correlation with scores using equal weights, and the descriptive and empirical results using respective measures (equal-weighted and PCA-weighted) are very similar.
We categorised the country initial conditions based on the median values of MPOWER Score and adult smoking prevalence, resulting in a reasonable distribution. Dividing countries using a 75 percentile cut-off or a 25 percentile cut-off ended up with too few countries in the HM-HP and LM-HP categories to make robust conclusions about the association for these two groups. We, therefore, used the median cut-off.
We checked the sensitivity of our analysis by pulling out an individual component from MPOWE, and estimated Equation 8 for POWE, MOWE, MPWE, MPOE and MPOW Scores instead of MPOWE Score (online supplementary appendix table A5). The association between the non-fiscal tobacco control measure and adult daily smoking prevalence remained very similar when individual components are individually pulled out from MPOWE for the HM-HP, HM-LP and LM-LP country groups. For the LM-HP country group, results remain similar when W, O and M are individually pulled out, but the association estimates become statistically insignificant when E and P are individually pulled out. In general, our results are not driven by any individual component of the MPOWER.
Supplemental material
Conclusion
A decade after the introduction of the WHO MPOWER package, we observed that countries with higher initial tobacco control efforts and higher smoking burden were able to reduce the age-standardised adult daily smoking prevalence significantly. Our findings suggest that as countries continue to enhance public health policy and health service provisions geared towards tobacco use control and prevention, the impact of these interventions is expected to be strengthened going forward.
What this study adds
What is already known on this subject
One strand of studies on MPOWER employed ex ante projection models to predict the expected impact of MPOWER implementation on tobacco smoking and asserted a negative association.
A second strand of studies investigated the association between varying levels of MPOWER implementation and smoking prevalence. Although, in general, the studies suggest a negative relationship between MPOWER Score and the change in smoking prevalence, a few recent studies found weak or no evidence of a significant association.
What important gaps in knowledge exist on this topic
At the initial stages of MPOWER roll-outs, the country situations in terms of smoking prevalence and existing tobacco control policy infrastructure were heterogeneous. The existing literature does not explore how the association between MPOWER intervention implementation and smoking prevalence differs for countries with different initial conditions.
There is dearth of studies that explore the association of smoking prevalence with tobacco control measures across two separate dimensions: the multisectoral non-fiscal interventions (ie, MPOWE) and the fiscal measure (ie, tobacco taxation—R).
What this study adds
This study explores how smoking prevalence and MPOWER implementation evolved in countries with different initial smoking burden and tobacco control preparedness and offers an analysis that relates smoking prevalence with the fiscal and the non-fiscal intervention components of tobacco control.
A decade after the introduction of the WHO MPOWER package, we observed that the countries with higher initial tobacco control preparedness and higher smoking burden were able to reduce the adult daily smoking prevalence significantly.
Data availability statement
Data are available in a public, open access repository. We used data from the six rounds of the WHO Reports on the Global Tobacco Epidemic, available at https://www.who.int/tobacco/mpower/en/
Ethics statements
Patient consent for publication
Footnotes
Contributors All authors participated in the development of the study plan and analysis, interpretation of results and the writing of the paper.
Funding The authors have not declared a specific grant for this research from any funding agency in the public, commercial or not-for-profit sectors.
Disclaimer The findings and conclusions in this report are those of the authors and do not necessarily represent the official position of the Centers for Disease Control and Prevention, the World Health Organization and the American Cancer Society.
Competing interests None declared.
Provenance and peer review Not commissioned; externally peer reviewed.