Article Text

Abstract
Objectives This study estimates the relative contribution of policies implemented between 1998 and 2010 to reductions in smoking prevalence by 2010. It then models the impact of implementing stronger policies, relative to a scenario of inaction, on smoking prevalence and smoking-attributable mortality in Ireland.
Methods IrelandSS is an adapted version of SimSmoke, a dynamic simulation model used to examine the effect of tobacco control policies on smoking prevalence, through initiation and cessation, and associated future premature mortality.
Results Model predictions for smoking prevalence are reasonably close to those from surveys. As a result of tobacco control policies implemented between 1998 and 2010, there was a 22% relative reduction in smoking prevalence and 1716 fewer smoking-attributable deaths (SADs) by 2010 increasing to a 29% relative reduction in prevalence and 50 215 fewer SADs by 2040. With the introduction of stricter FCTC-compliant policies in 2011, the smoking prevalence can be decreased by as much as 13% initially, increasing to 28% by 30 years. With these stronger policies, a total of 24 768 SADs will be averted by 2040.
Conclusions Predictions from the IrelandSS model suggest that policies implemented between 1998 and 2010 have had considerable effect; however, appreciable reductions in smoking prevalence and SADs can still be achieved through increasing taxes, maintaining a high-intensity tobacco control media campaign, introducing graphic health warnings and improving smoking cessation services.
- Tobacco control policy
- smoking prevalence
- smoking-attributable deaths
- simulation model
- Ireland
- surveillance and monitoring
- public policy
- priority/special populations
- global health
- price
- smoking caused disease
- respiratory health
- exposure assessment
- prevalence
- taxation and price
- harm reduction
- cessation
- economics
Statistics from Altmetric.com
- Tobacco control policy
- smoking prevalence
- smoking-attributable deaths
- simulation model
- Ireland
- surveillance and monitoring
- public policy
- priority/special populations
- global health
- price
- smoking caused disease
- respiratory health
- exposure assessment
- prevalence
- taxation and price
- harm reduction
- cessation
- economics
Introduction
Over the last decade, countries around the world have implemented increasingly stringent tobacco control policies in an effort to reduce tobacco use and its negative consequences.1 Ireland has extended tobacco marketing bans, strengthened health warnings, increased availability of smoking cessation services, raised taxes such that Ireland currently has one of the highest tobacco product prices in Europe and introduced the first national comprehensive smoke-free workplace law extending to bars and restaurants.1 This progress ranked Ireland ahead of its European counterparts on the Tobacco Control Scale in 2005 and among European tobacco control leaders in the 2007 and 2010 rankings.2 However, Eurobarometer (2009) estimates of smoking prevalence at 31% place Ireland above the European Union average (29%)3, a ranking incommensurate with the progressive tobacco control policies implemented. Have strong tobacco control policies failed to bring about anticipated reductions in smoking prevalence in the Irish context?
This paper applies IrelandSS, based on the SimSmoke tobacco control policy simulation model, to (1) examine the effects of tobacco control policies implemented between 1998 and 2010 on reductions in smoking prevalence and smoking-attributable deaths (SADs) by 2010, (2) predict the effect on smoking prevalence and SADs if no further action was taken to strengthen tobacco control policies and (3) estimate the effect on smoking prevalence and SADs of implementing stronger policies fully consistent with WHO recommendations.
Methods
The simulation model begins in a baseline year, 1998, with the population divided into smokers, never-smokers and former smokers by age and gender. The baseline year is chosen as a year before major policy intervention to establish pre-policy trends. In addition, 1998 was the first year of the National Survey of Lifestyles Attitudes and Nutrition (SLÁN), which provides requisite smoking prevalence data.4
SimSmoke includes a population model, a smoking model, a SAD model and policy modules.5 A discrete time first-order Markov process is employed to project future population growth and smoking rates from the base year to future years.
Population model
Population data (1998), mortality rates (2002) and fertility rates (2004) were obtained from the Central Statistics Office (http://www.cso.ie). Population projections from the model were compared with actual and projected population data by age and gender for years 1998 through 2040 and adjusted to within 3% of the actual population.
Smoking model
Within the smoking model, individuals are classified as never-smokers from birth until they initiate smoking or die. They may evolve from current to former smoker through cessation or may return to smoker through relapse.
The model is initialised with smoking data from the SLÁN surveys conducted in 1998 (n=6539; 62% response rate) and validated with data from the surveys in 2002 (n=5992; 53% response rate) and 2007 (n=10 364; 62% response rate). These surveys use multi-stage stratified random sampling to select a nationally representative sample of the Irish population aged 18 years and over using the electoral register (1998, 2002) or the GeoDirectory (2007) as the sampling frames. The 2007 sample provides better representation of immigrants and young people who were less likely to be on the electoral register. The 1998 and 2002 surveys assessed smoking status using a self-completed postal questionnaire with the questions: (1) Do you smoke cigarettes now: no, yes regularly and yes occasionally (<1/day) and (2) Did you ever smoke cigarettes in the past: no, current smoker, yes occasionally and yes regularly. Current smokers were defined as those who smoked cigarettes regularly or occasionally, while former smokers were defined as those who did not currently smoke but had smoked regularly in the past. In 2007, smoking status was assessed using an interviewer-administered questionnaire with the questions: (1) Have you smoked at least 100 cigarettes in your lifetime: yes, no and (2) Do you now smoke: every day, some days (current smokers) or not at all (former smokers). Former smokers were distinguished by time since quit (<1, 1–2, 3–5, 6–10, 11–15, 16+ years ago).
For model validation, we also used annual data from the 2003–2010 Office of Tobacco Control (OTC) surveys. These data are based on telephone interviews with 1000 individuals monthly, and smoking is defined as having smoked one cigarette or more in the last week.
Due to empirical challenges in measuring initiation, rates of initiation are estimated as the difference between the smoking rate at that year of age and the rate at the previous age year. Smoking rates peaked at age 27 for men and 21 for women; we allow initiation through age 26. Cessation rates were available from the 2007 survey only and are measured after age 26 since quitting before that age does not have discernable effects on mortality.6 One-year cessation rates are estimated as the number of former smokers who quit in the last year, divided by the number of those smoking 1 year ago (current smokers plus those who quit in the last year). US relapse rates were used,7 ,8 but the per cent of ex-smokers by years quit after the first year were found to be similar to US rates.9 Since about 50% of those who quit will relapse within a year, a 2%–3% net first year cessation rate is obtained.
Smoking-attributable deaths
Death rates by age, gender and smoking status were calculated from death rates, smoking rates and RRs. The number of current and former smokers at each age was multiplied by their respective excess risk and summed to obtain total SADs.
Due to a lack of studies for Ireland and given the similarities between Ireland's smoking history and that of the USA, we use RR estimates from the US Cancer Prevention Study II,10 ,11 which are approximately 2.4. For former smokers, we allow RRs to decline at the rate observed in US studies.12
Tobacco control policy module
Policy effect sizes are expressed in terms of percentage reductions (relative to the initial smoking prevalence) and are (unless otherwise indicated in table 1) applied to the smoking prevalence rate in the year the policy is implemented and to initiation and cessation rates in future years if the policy is maintained. The parameters in the model used to generate the policy effect sizes are based on thorough literature reviews and expert panel advice.13 The effect of implementing each policy depends on its initial level since policy effect sizes depend on the change in policy from its initial level. We input data on policy levels for each year from 1998 through 2010 based on information from the MPOWER report1 and from the OTC with corroboration from Irish tobacco control researchers. Policy descriptions with their effect sizes are described in table 1, and the policies implemented in Ireland between 1998 and 2010 are described in table 2. Detailed methodology can be found in a longer report.9
Policy descriptions and effect sizes of the IrelandSS model and policies in Ireland
Tobacco control policies in Ireland
Analyses
IrelandSS estimates smoking prevalence and SADs from 1998 forward. These outcomes are estimated from 1998 to 2010 incorporating the policies in force each year and projects future outcomes for 2011 through 2040.
To validate the model, we compared predicted smoking rates by gender and age to annual smoking rates by age and gender from the SLÁN (1998–2007) and OTC surveys (2003–2010). We compare percentage changes in smoking rates between survey years to relative changes predicted by the model since our focus is changes in trend due to policy changes.
To consider the contribution of policies implemented since 1998, we set policies through 2010 to their 1998 levels. The difference between the smoking rate with policies at their 1998 level and the smoking rate with all policies in place then yields the net effect of policies implemented since 1998. For the role of single policies, we compare the scenario with only that policy implemented to the scenario with policies at their 1998 level. Because the reduction in smoking rate due to each policy depends on other policies in effect, we examine the reduction attributed to each individual policy relative to the summed effect of all policies.
The model is then used to compare two future scenarios: (1) the status quo scenario where policies are held constant at 2010 levels and (2) the stronger policy scenarios where policies fully compliant with the WHO FCTC recommendations are implemented in 2011. Deaths averted are calculated as the difference between the number of deaths under the stronger policy scenario and the number of deaths under the status quo.
Results
Predictions of smoking prevalence from 1998 to 2010
Between 1998 and 2010, IrelandSS predicts that male smoking prevalence (reported as a per cent of males aged 18 years and above) decreased from 33.4% to 26.1%, a 21.8% decline relative to the 1998 level (figure 1), and that female prevalence decreased from 31.0% to 25.1%, a 19.0% relative decline (figure 2).

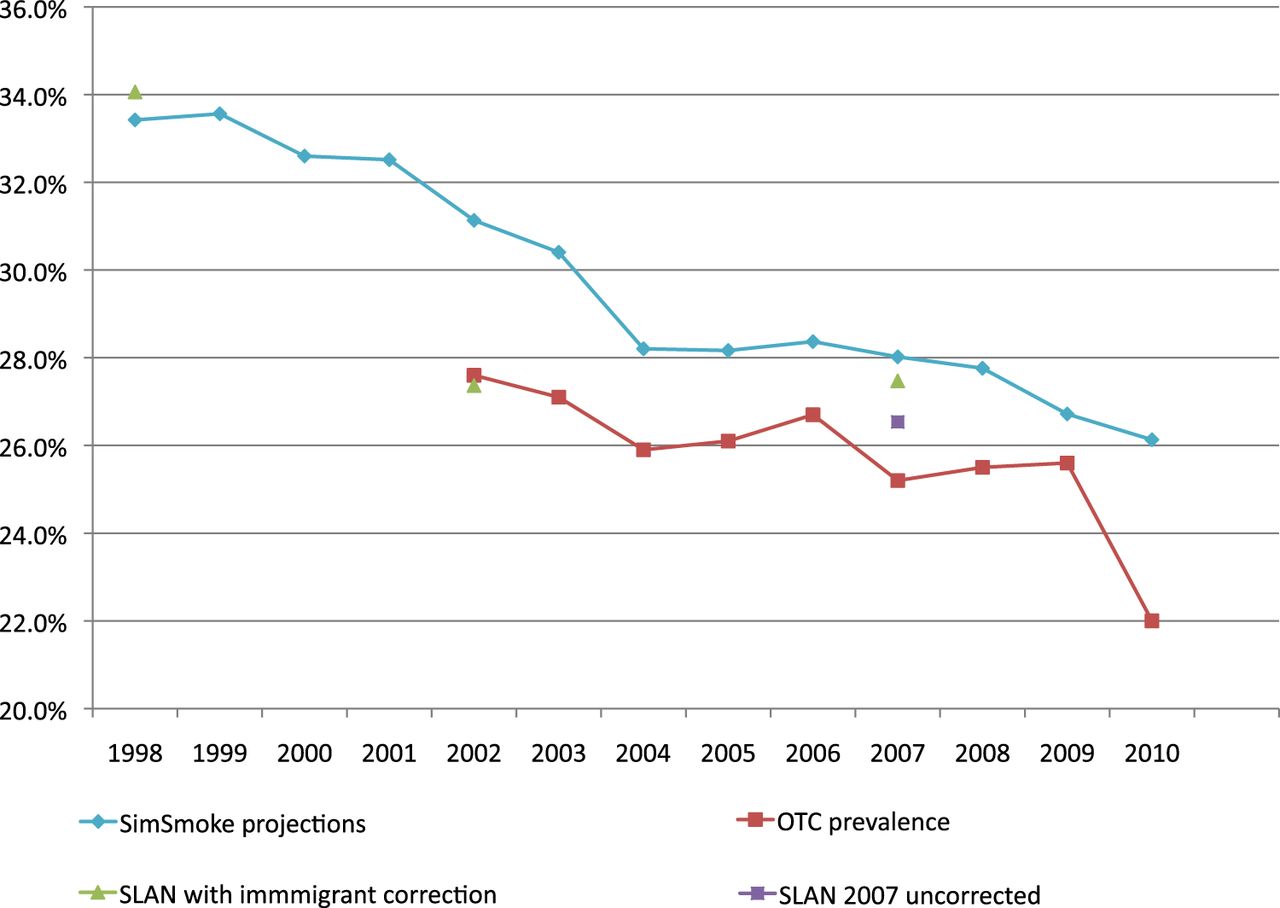
Predicted versus actual male smoking prevalence, 18 years and above, 1998–2010.

Predicted versus actual female smoking prevalence, 18 years and above, 1998–2010.
Between 1998 and 2007, IrelandSS predicts a 16.2% relative decline for men and a 14.2% decline for women. According to SLÁN data, male smoking rates declined from 34.1% in 1998 to 27.4% in 2002 but rose to 30.6% in 2007 (a 10.3% drop from 1998), while females rates declined from 32.5% in 1998 to 28.0% in 2002 and 26.5% in 2007 (an 18.3% drop from 1998). The model under-predicts the decline relative to SLÁN for 2002 but over-predicts the decline relative to SLÁN for 2007. However, the 2007 SLÁN began asking individuals if they had smoked 100 or more cigarettes in their lifetime and changed sampling frames, thereby broadening the coverage to include more immigrants, so that the populations are not comparable. Using prevalence estimates with immigrants from other than the UK omitted, the model predicts a relative decline of 16.2% for men between 1998 and 2007 compared with 19.3% using the adjusted SLÁN data and a relative decline of 14.2% for women relative to 17.8% using the adjusted SLÁN data.
Data from the OTC indicate that smoking prevalence had declined from 30% in June 2003 to 23.6% in June 2005 then increased and fell back to 23.6% in March 2008. In May 2008, there was a change in sampling method. After adjusting for this change, male prevalence between 2003 and 2010 showed a 13.6% relative decline compared with 14.1% from IrelandSS and females showed an 18.8% relative decline compared with 12.3% from the model.
Thus, after adjusting the SLÁN for immigration, the IrelandSS under-predicts the relative reduction in smoking prevalence between 1998 and 2007 period but is within 16% (eg, (19.3–16.2)/19.3) for males and within 22% (eg, (18.3–14.2)/18.3) for females. Between 2003 and 2010, the model is within 4% of the changes using the OTC data but almost 50% different for women. However, as shown in figure 2, the OTC showed a large decline for women in 2010. Between 2003 and 2009, the model over-predicts the decline in female rates (10.5% vs 5.5% from the OTC). Thus, the over-prediction of 5.0 percentage points using 2009 is close to the under-prediction of 5.9% (18.8%–12.3%) using 2010. Although highly sensitive to the validation data, the model predicts reasonably well over the two time periods, and, as shown in figures 1 and 2, model predictions mirror the large changes seen between 1998 and 2007 using the corrected SLAN data.
Role of policies
Holding policies constant at their 1998 levels, the model projected a slow downward trend for both male and female smoking prevalence. As a result of policies implemented between 1998 and 2010, the predicted male and female smoking prevalence rates in 2010 were each 21.8% lower relative to the levels that they would have been in 2010 without such policies implemented. As a result of the policies implemented between 1998 through 2010, 1716 fewer SADs are estimated by 2010. By 2040, the relative reduction in prevalence increases to 29%, with 50 215 fewer SADs. Of the 21.8% reduction in male smoking prevalence resulting from policies implemented between 1998 and 2010, 45% is attributed to price increases, 25% to strict smoke-free air laws, 1% to media/tobacco control campaigns, 16% to stricter advertising restrictions, 4% to stricter health warnings and 9% to cessation treatment programmes.
Status quo scenario—policies held constant at 2010 levels
If tobacco control policies remain unchanged from their 2010 levels, the status quo scenario, male smoking is projected to decrease from 26.1% in 2010 to 20.0% in 2040 (table 3), a decline of 23.2% relative to 2010. With female smoking prevalence at 25.1% in 2010, a 19.6% relative reduction is projected by 2040.
IrelandSS projections of male smoking prevalence for ages 18 and older, Ireland, 2010–2040
The estimated number of SADs in 2010 is 6342 (4165 for men and 2177 for women) (table 4). Relative to 2010, annual male SADs are projected to increase by 1759 between 2010 and 2030 and decrease slightly by 2040. Female SADs were 2177 annually in 2010 and projected to increase by 2100 by 2040.
IrelandSS estimates of total smoking-attributable deaths and deaths averted for selected years and cumulative over the years 2011–2040
Stronger policy scenario—policies fully consistent with MPOWER
Relative to the status quo scenario, the greatest reductions in male smoking prevalence (as shown in table 3) can be realised through: (1) implementing high-intensity tobacco control media campaigns resulting in a 6.3% initial reduction increasing to an 8.9% reduction by 2040; (2) increasing cigarette excise taxes to 70% of price leading to a 3.3% initial reduction increasing to 6.6%; (3) improving smoking cessation services leading to a 2.2% initial reduction increasing to 5.9% and (4) introducing graphic pictorial health warnings with a 1.2% reduction increasing to 1.6% reduction. Youth access policies have minimal initial effect because they only affect youth who are a small per cent of the population but show a 5.4% reduction by 2040. Similar relative reductions are predicted for women. These policies have minimal effects (none for youth access) on SADs initially, but the effects grow over time. Cumulating over the years 2011–2040 (as shown in table 4), the number of deaths averted by 2040 as a result of implementing a high-intensity media campaign is 10 621, through improving cessation treatment is 7476, by increasing taxes is 3681, by introducing graphic warnings is 2355 and from enforcing youth access laws is 125. Those policies with greater effects on younger populations have more delayed effects on SADs.
With the implementation of a comprehensive set of policies, smoking prevalence rates are projected to initially decline by 13.1% for men and 13.2% for women relative to the status quo. Relative to the status quo prevalence in 2040, smoking prevalence is projected to be 27.7% less for men and 28.1% less for women. As shown in table 4, the model projects that a comprehensive set of policies would avert 1561 (905 men and 656 women) annual SADs in 2040. Summing over the years 2010–2040, a total of 24 768 (15 062 men and 9706 women) SADs are averted by 2040 compared with the status quo.
Discussion
IrelandSS applies population, smoking prevalence and policy data for Ireland to the previously validated19–21 SimSmoke tobacco control simulation model and was found to predict trends in smoking prevalence relatively well between 1998 and 2010. Upon distinguishing the contribution of tobacco control policies implemented in Ireland between 1998 and 2010 from long-term trends, the model shows that policies have played an important role in reducing smoking prevalence over this period, explaining a 22% relative reduction in prevalence by 2010, increasing to a 29% relative reduction by 2040. Because IrelandSS tended to under-predict relative reductions in smoking prevalence compared with surveys, this estimate may be understated.
Almost half of the 22% relative reduction in prevalence is explained by price increases, while a quarter is explained by smoke-free workplace legislation and 16% through stricter advertising restrictions. While this is partially a function of the relative effectiveness of these policies, it also reflects the extent to which the Irish government has used these policies as levers to change smoking behaviour over the past decade. Ireland has shown leadership in implementing comprehensive smoke-free workplace legislation, stronger bans on advertising extending to the point of sale and cigarette tax increases.
The National Cardiovascular Policy targets call for a reduction in smoking prevalence in Ireland by one percentage point per annum to 19% by 2019. IrelandSS projects that male (female) smoking prevalence would reach 19.5% (19.9%) by 2020 if all policies considered were introduced in 2011. Thus, national policy targets can be achieved only with the immediate implementation of a comprehensive set of strong FCTC-compliant policies.
Implementation of FCTC-compliant policies would require further investment in mass media campaigns and smoking cessation services, which IrelandSS implicates as central to achieving prevalence reductions and health gains. Recent disinvestment in tobacco control, as seen in the Netherlands where government reversed their decision to reimburse a Stop Smoking programme through health insurance, weakened the smoke-free laws, cancelled mass media campaigns and withdrew funding,22 raises fear that the deepening economic crisis and public sector cuts might derail tobacco control efforts in Ireland. However, planned implementation of pictorial health warnings on tobacco packages in 2013, the launch of a new multifaceted media campaign—the QUIT campaign—and further tax increases in the recent budget despite warnings from the tobacco industry23 and a report by the Revenue Commission24 suggest that the Irish Government is still committed to continued progress in tobacco control.
Model predictions should be interpreted bearing in mind the limitations inherent to simulation modelling. The model's results depend on the reliability of the data, the estimated parameters and the assumptions used in the model.
Policy effect sizes are based on the advice of an expert panel and literature reviews, which vary in depth and consistency across policies. In other work,25 we suggested a lower bound 25% below and an upper bound 25% above the effect sizes for cigarette price policy. For smoke-free air laws, marketing restrictions, health warnings and media campaigns, a bound of 50% above and below the SimSmoke effect sizes were suggested. For cessation treatment policies, we suggested a bound of 50% below, but 100% above the effect size, with the upper bound reflecting the potential to improve treatment through better follow-up. Finally, for youth access, we have used a bound ranging from no effect (based on the many studies finding no effect) to 100% above (reflecting that our estimates incorporate substitution to non-retail sources).21 Uncertainty should also be attributed to the combined effect when more than one policy is implemented. We allowed for synergies between media campaigns and other policies but otherwise assumed that the effect of adding a second policy is reduced if another policy is simultaneously implemented. Previous studies, however, provide limited guidance on whether implementing multiple policies has offsetting or synergistic effects.13 Overall, our finding that actual reductions in smoking prevalence were slightly greater than predicted by IrelandSS over the validation period (1998–2010) suggests that effect sizes used in the model may be understated.
Despite considerable net immigration over the study period, the model does not consider the effects of immigration since data did not distinguish smoking status by ethnicity prior to 2007. However, between 1996 and April 2004, just prior to EU enlargement, gross immigration increased from 40 000 per annum to 50 000 per annum and net migration increased from 8000 per annum to 32 000; following enlargement in May 2004, gross immigration increased to 86 900 by 2006 and net migration continued to increase to 70 000 per annum.26 After 2004, most of these migrants came from the new accession states, particularly Poland. In 2005, eight of the 10 accession states had smoking prevalence rates above the EU25 average.27 Kabir et al 28 found that immigrants to Ireland from Poland had average smoking rates of 45%, substantially higher than Irish rates and 57% solely purchased their cigarettes from Poland,28 thereby attenuating the effect of tax increases in Ireland. While IrelandSS predicted larger relative reductions in smoking prevalence than those observed in SLÁN data including immigrants, the model predicted more accurately once adjustments were made to exclude non-UK immigrants. The high rates of immigration from high smoking prevalence countries into a relatively small population at least partly explain why Ireland's smoking prevalence rates compare unfavourably to EU counterparts despite progressive tobacco control policies.
The model does not incorporate the effect of short-term fluctuations in income on smoking rates nor does it consider changes in affordability resulting from higher average incomes. Ireland experienced considerable income growth in the 1990's continuing through the first 9 years of the study period to 2006 and contracting over the latter 4 years with the economic recession. Despite having among the highest cigarette prices in the world, cigarettes have become increasingly more affordable between 1990 and 2006.29 Finally, there was insufficient data to model smoking prevalence trends and the effect of policies by socioeconomic position, but future tobacco control efforts must target those of lower socioeconomic status if they are to be successful.
Conclusions
While Ireland has implemented progressive tobacco control policies in recent years with considerable effect, there is still scope to strengthen these policies consistent with the MPOWER policy guidelines and the legally binding FCTC treaty. Appreciable reductions in smoking prevalence and SADs can be achieved through increasing taxes, maintaining a high-intensity tobacco control media campaign, introducing graphic health warnings and improving smoking cessation services. Our findings also highlight the interrelatedness of tobacco control prospects between European Union countries; while the needs of immigrant populations with high smoking prevalence should be addressed within countries, strong policies are needed across countries of the European Union to achieve the full potential of tobacco control.
What this paper adds
-
IrelandSS provides an estimate of the relative contribution of different tobacco control policies to overall reductions in smoking prevalence.
-
Analysis suggests that tobacco control policies have been successful in achieving a 22% relative reduction in smoking prevalence and 1716 fewer SADs by 2010.
-
Implementing policies fully consistent with FCTC could achieve a 28% relative reduction in smoking prevalence by 2040 and prevent 24 768 premature SADs over the next 30 years.
-
Findings also highlight the importance of considering the dynamics of population migration in monitoring smoking prevalence and evaluating policy effectiveness.
References
Footnotes
-
Funding This is a partial deliverable within the PPACTE Project ‘Pricing Policies and Control of Tobacco in Europe’ and is partly funded by the European Commission through FP7 HEALTH-F2-2009-223323. LC is an HRB PhD Scholar in Health Services Research partly funded by the HRB in Ireland under Grant no. PhD/2007/16.
-
Competing interests None.
-
Provenance and peer review Not commissioned; externally peer reviewed.
-
Data sharing statement We generally adopt the following four-part plan for the dissemination of models and modelling results. (1) Enhancing understanding of model structures by keeping up to date versions of documentation on the PPACTE website. (2) Active solicitation of enquiries from outside modellers and interested end users of results based on national or regional issues of interest amenable to modelling. (3) Enhancing the ability of others to run the models directly by developing publicly accessible versions of executable programmes of model or model subcomponents when feasible. (4) Enhancing access to source code by releasing code in the context of collaborations or other specified scenarios. Outside groups may be interested in obtaining source code from one or more of the models for research or commercial purposes. When feasible, collaborations will be pursued. Dr Levy has a long history of releasing executable versions of its SimSMOKE model for use by national and state Departments of Public Health or other entities and will continue to pursue such collaborations. In many cases, however, significant effort may be required to provide ongoing support, so that users could generate valid output and could interpret it correctly. In this case, we will need to obtain future funding for work.