Article Text

Abstract
Background In the UK, transnational tobacco companies (TTCs) have been arguing that levels of illicit trade are high and increasing and will rise further if standardised packaging is implemented. This paper examines trends in and accuracy of media reporting of, and industry data on, illicit tobacco in the UK.
Methods Quantification of the volume, nature and quality of press articles citing industry data on illicit tobacco in UK newspapers from March 2008 to March 2013. Examination of published TTC data on illicit, including a comparison with independent data and of TTC reporting of Her Majesty's Revenue and Customs data on illicit.
Results Media stories citing industry data on illicit tobacco began in June 2011, 2 months after the Tobacco Control Plan for England, which heralded standardised packaging, was published. The majority of data cited are based on industry Empty Pack Surveys for which no methodology is available. For almost all parts of the country where repeat data were cited in press stories, they indicated an increase, often substantial, in non-domestic/illicit cigarettes that is not supported by independent data. Similarly, national data from two published industry sources show a sudden large increase in non-domestic product between 2011 and 2012. Yet the methodology of one report changes over this period and the other provides no published methodology. In contrast, independent data show steady declines in non-domestic and illicit cigarette penetration from 2006 to 2012 and either a continued decline or small increase to 2013.
Conclusions Industry claims that use of Non-UK Duty Paid/illicit cigarettes in the UK is sharply increasing are inconsistent with historical trends and recent independent data. TTCs are exaggerating the threat of illicit tobacco by commissioning surveys whose methodology and validity remain uncertain, planting misleading stories and misquoting government data. Industry data on levels of illicit should be treated with extreme caution.
- Illegal tobacco products
- Tobacco industry
- Advocacy
This is an Open Access article distributed in accordance with the Creative Commons Attribution Non Commercial (CC BY-NC 3.0) license, which permits others to distribute, remix, adapt, build upon this work non-commercially, and license their derivative works on different terms, provided the original work is properly cited and the use is non-commercial. See: http://creativecommons.org/licenses/by-nc/3.0/
Statistics from Altmetric.com
Introduction
There is overwhelming evidence of the transnational tobacco companies’ (TTCs) long involvement in the global illicit tobacco trade.1–5 In the UK, in the 1990s, TTCs were accused of facilitating smuggling by deliberately oversupplying brands to countries where there was no demand for them.6 Although the nature of the illicit tobacco market has since changed substantially,5 emerging evidence suggests the TTCs have continued to be involved in the illicit trade and failed to control their supply chain7–10 despite signing agreements to address both these issues.9 ,11–14
For example, cigarette smuggling to and through Bulgaria continued after the deals reached the European Union (EU),2 and Japan Tobacco International (JTI) remains under investigation by the European Anti-Fraud Agency (OLAF)15 ,16 following evidence that its involvement in illicit continued after it signed an anti-smuggling agreement with the EU.7
In the UK, Her Majesty's Revenue and Customs (HMRC) estimated that in 2011 the aggregate supply of certain brands of Roll Your Own tobacco (RYO) to some countries exceeded legitimate demand by 240%.9 ,17 Similarly, massive TTC overproduction of cigarettes in Ukraine has been shown to fuel the illicit market in Europe,10 a finding supported by a recent pan-European survey showing that illicit tobacco use was greatest in those living in countries sharing a land or sea border with Ukraine, Russia, Moldova or Belarus,18 and by data from Poland indicating that levels of illicit fall as one moves from northeast to southwest across the country.19 Furthermore, Philip Morris International's (PMI) own data suggest that in 2010 around a quarter of illicit cigarettes in Europe were PMI's own brands.20
Despite historical involvement in the illicit trade1 ,3–6 and recent evidence of complicity,2 ,7 TTCs continue to use the threat of illicit tobacco to argue against key tobacco control policies.21–30 For example, TTCs consistently and misleadingly argue that tobacco tax and price rises will increase the illicit tobacco trade,27 even in jurisdictions where much of the price increases are directly attributable to industry price increases rather than tax increases.30 ,31
More recently, TTCs have argued that standardised packaging (SP) will increase smuggling of genuine and counterfeit cigarettes.21–23 ,26 This argument was widely used in Australia (the first country to introduce SP in December 2012)32–41 despite evidence that the tobacco industry, and those working on its behalf, exaggerated the scale of the problem.29 ,42 ,43
In response to the 2011 Tobacco Control Plan for England,44 which included a recommendation to consider SP, and the public consultation that followed in 2012,45 the TTCs recycled the illicit trade argument in the UK.21–23 ,26 ,46 ,47 Despite evidence that these illicit trade arguments are misleading,48 they may carry more weight in the UK, where the illicit tobacco trade49 is significantly greater than in Australia.50
This paper therefore aims to examine trends in media reporting of TTCs’ data on illicit tobacco penetration, to assess the accuracy of the TTCs’ data and their reporting of independent data on the extent of illicit tobacco trade in the UK.
Background: problems with measuring the illicit tobacco trade
Due to its illegal nature, the illicit tobacco trade is difficult to measure. Those involved do not make records public, law enforcement agency data are often kept confidential and supplementary methods of estimation have limitations.51 ,52 Furthermore, the various forms of illicit and other non-duty paid tobacco (table 1) cause confusion, leading to difficulties in accurately comparing data. Illicit tobacco (see table 1 for definition) is illegal product on which no tobacco duties have been paid. It includes smuggled genuine product, counterfeit product and ‘Cheap Whites’. It does not, however, include products bought legally on which tobacco duties have not been paid—those purchased duty free or abroad for personal use (known as cross-border sales) (table 1). Thus, non-duty paid (or non-domestic) product, referred to in the UK as Non-UK Duty Paid (NUKDP) product, includes illicit tobacco and cross-border sales (table 1). In the UK, the latest HMRC estimates suggest that 10% of the cigarette market is NUKDP, 70% of this comprising illicit cigarettes and 30% cross-border sales.49
Illicit trade terminology
Most tobacco industry data on illicit comes from the industry's Empty Pack Surveys (EPS), a system of collecting discarded cigarette packs to determine their authenticity. Although industry reports promote EPSs,8 previous work has raised serious concerns about the accuracy of industry EPS data.9 ,20 ,25 ,53–55 Furthermore, EPSs can only measure non-domestic product, being unable to distinguish which of this is legal non-domestic and which is illicit.20 ,55 ,56 Thus, if EPS data on non-domestic product are presented as measures of illicit, they will give artificially high figures.9
In the UK, HMRC estimates the extent of the illicit tobacco trade using a combination of survey and sales data. Total tobacco consumption is estimated using survey data adjusted for under-reporting. Legal sales are then subtracted from the consumption estimate to provide an estimate of illicit. Adjustments are also made for cross-border sales. Recognising the limitations of the estimates produced, HMRC reports a range and a midpoint estimate of illicit and NUKDP.49
Methods
Media coverage
Media coverage of the illicit tobacco trade in UK newspapers (national, regional and local) between March 2008 and March 2013 was identified using the Nexus UK press database.60 Search terms included ‘cigarette and illegal’, ‘cigarette and smuggling’, ‘tobacco and illegal’, ‘tobacco and smuggling’, ‘tobacco and illicit’. Each set of terms was combined with the names of the major TTCs: British American Tobacco (BAT), JTI, Imperial Tobacco (IMT) and PMI. Only articles citing industry data or surveys on illicit were included, while articles referring to the illicit tobacco trade in general, but giving no data, were excluded.
In addition to counting the number of newspaper articles each month, we categorised the data contained in each article by tobacco type (whether the data referred to cigarettes, RYO or both), tobacco company providing the data or mentioned in the article and other companies mentioned (eg, market research companies); methodology underlying the data; and whether the article clarified the nature of the data including the difference between cross-border and illicit.
All articles were uploaded into NVivo to identify the most frequently used terminology. To further assess the accuracy of the coverage, we attempted to obtain the data underlying the press coverage by searching for industry press releases and reports published around the time of the press articles. Where data on levels of illicit penetration were available for the same geographic area over time (whether presented in the same or different press articles), these data were presented graphically using the year when the data were obtained rather than published.
Formally published industry data
National data
We aimed to identify tobacco industry data on illicit tobacco (both cigarettes and RYO) in the UK. However, an initial review indicated that the majority of industry data only measured NUKDP cigarettes (PMI data in its Project Star report were unique in being broken down into illicit and cross-border sales).8 ,24 ,61 ,62 Analysis was therefore restricted to NUKDP cigarettes.
Project Star reports, produced annually for PMI, were the primary source of industry data as the early reports compile data from a number of industry sources, including the Tobacco Manufacturers’ Association (TMA), JTI's Pack Swap survey and PMI's EPSs.8 ,61 ,62 The other report examined was JTI's 2012, The Billion Pound Drop report, the most comprehensive, publicly available industry document on NUKDP cigarettes in the UK.24 Searches of the TTCs’ websites and press releases undertaken in March 2013 provided no additional data.
Industry data were compared with data from independent sources, notably HMRC49 ,59 ,63 ,64 and a 2010 survey undertaken as part of a major EU research project, Pricing Policies and Control of Tobacco in Europe (PPACTE).18 ,65 For HMRC, we took the midpoint illicit cigarette market share estimate and added the cross-border sales estimate. For PPACTE, we took data on cigarettes only and combined data on illicit and non-domestic legal cigarettes as a proportion of total consumption using previous calculations.20 The PPACTE data cover England and not the UK.
Subnational data
Industry regional data on NUKDP cigarettes were obtained from JTI's The Billion Pound Drop report,24 and independent data from repeat NEMS Market Research surveys of smokers’ purchasing behaviours commissioned by public health groups in the northeast and southwest of England.66–70 These surveys are based on representative samples of adults aged 16 plus using a combination of telephone and in-street interviewing. The 2013 surveys comprised 1454 adults including 707 current smokers who provide the basis for the questions on illicit tobacco purchases in the northeast,70 and 2000 adults including 1183 smokers in the southwest.66
Industry reporting of HMRC data
Finally, to assess JTI's reporting of HMRC data, The Billion Pound Drop report24 was searched for all mentions of ‘HMRC’, ‘Her Majesty's Revenue and Customs’ and ‘Government’ to identify all references to HMRC data on illicit. All data cited were then compared for accuracy against the original HMRC source.
Results
Media coverage
Between March 2008 and May 2011, no articles citing tobacco industry illicit trade figures were published in the UK media (figure 1). Following the publication of the Tobacco Control Plan in March 2011, articles began to appear—14 were published in 2011, 26 in 2012 and 12 in the first three months of 2013 alone.

Number of press articles in UK newspapers citing industry data on illicit cigarettes and tobacco, 2008–2012, by month of publication.
Of the 52 articles, 23 (45%) mention PMI,71–93 12 cite JTI (some referring specifically to The Billion Pound Drop report or the data contained in it),72 ,94–104 13 cite IMT (many relating to EPS figures it gave at its Annual General Meeting in January 2013)105–117 and 5 refer to a number of tobacco companies.118–122 (The total adds to 53 as one article cites separate data from PMI and JTI.) In all bar seven articles, these companies are clearly cited as the source of the data.
Ten of the fifty-two articles also mention market analysis company, MS Intelligence, as having undertaken EPSs on industry's behalf;73–76 ,106 ,116–120 four of these specifying that the work was undertaken for a number of cigarette companies collectively.118–121
In terms of underlying methodology, 17 articles explicitly refer to EPSs,71 ,73–83 ,105 ,107 ,108 ,118 ,120 and a further 24 to survey data known to be based on EPSs (eg, data in The Billion Pound Drop, Project Star or MS Intelligence surveys).72 ,88 ,89 ,91–93 ,95 ,98–103 ,106 ,109–113 ,116 ,117 ,119 ,121 ,122 No article explains the methodology in any detail.
Accuracy of coverage
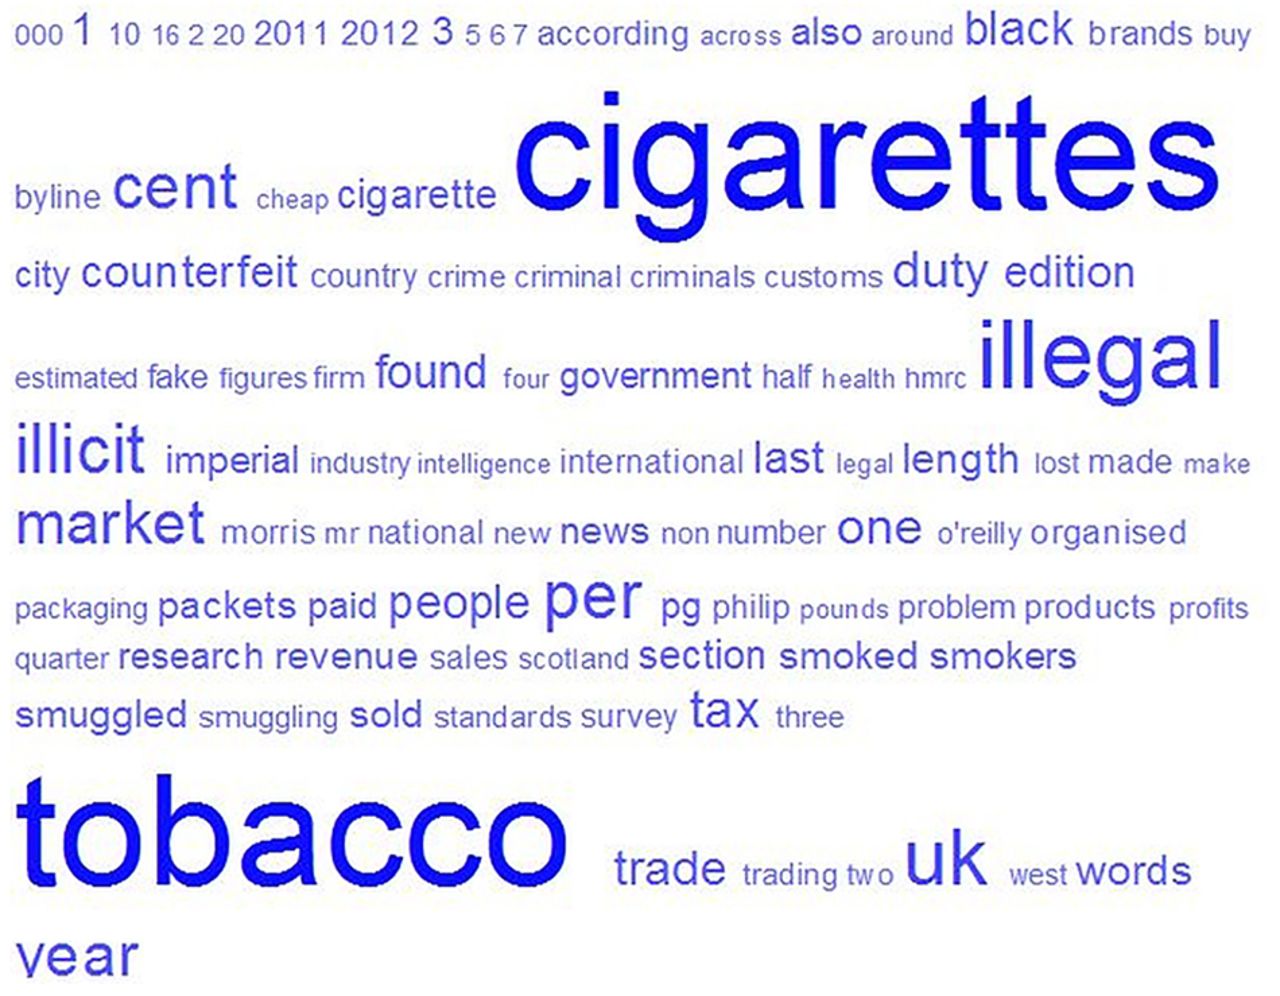
None of the articles explain the nature of the data or the difference between NUKDP and illicit. Article titles suggest the data refer to illicit, with 41 (79%) using the words illegal, illicit, counterfeit, fake or black market. The word cloud (figure 2) identifies illegal and illicit as the most frequently used words after cigarettes and tobacco. Yet, as we showed above, much, if not all, of the data comes from EPSs and the articles can therefore only present data on NUKDP rather than illicit.

NVivo word cloud analysis of 52 newspaper articles citing industry data on illicit/Non-UK Duty Paid tobacco and published between March 2008 and March 2013; the larger the word, the greater the usage of that word in the articles.
Just 4 of the 52 articles (8%)95 ,102 ,103 ,123 could be linked to published industry data—that from JTI's The Billion Pound Drop report, which gives no detail on underlying EPS methodology.24 This report presents NUKDP data,24 yet three of the four linked articles incorrectly refer to ‘illicit’ or ‘illegal’ cigarettes,95 ,102 ,123 while the fourth mentions ‘duty free’ and ‘counterfeit cigarettes’, but still inaccurately warns of a rise in ‘illegal’ cigarettes.103
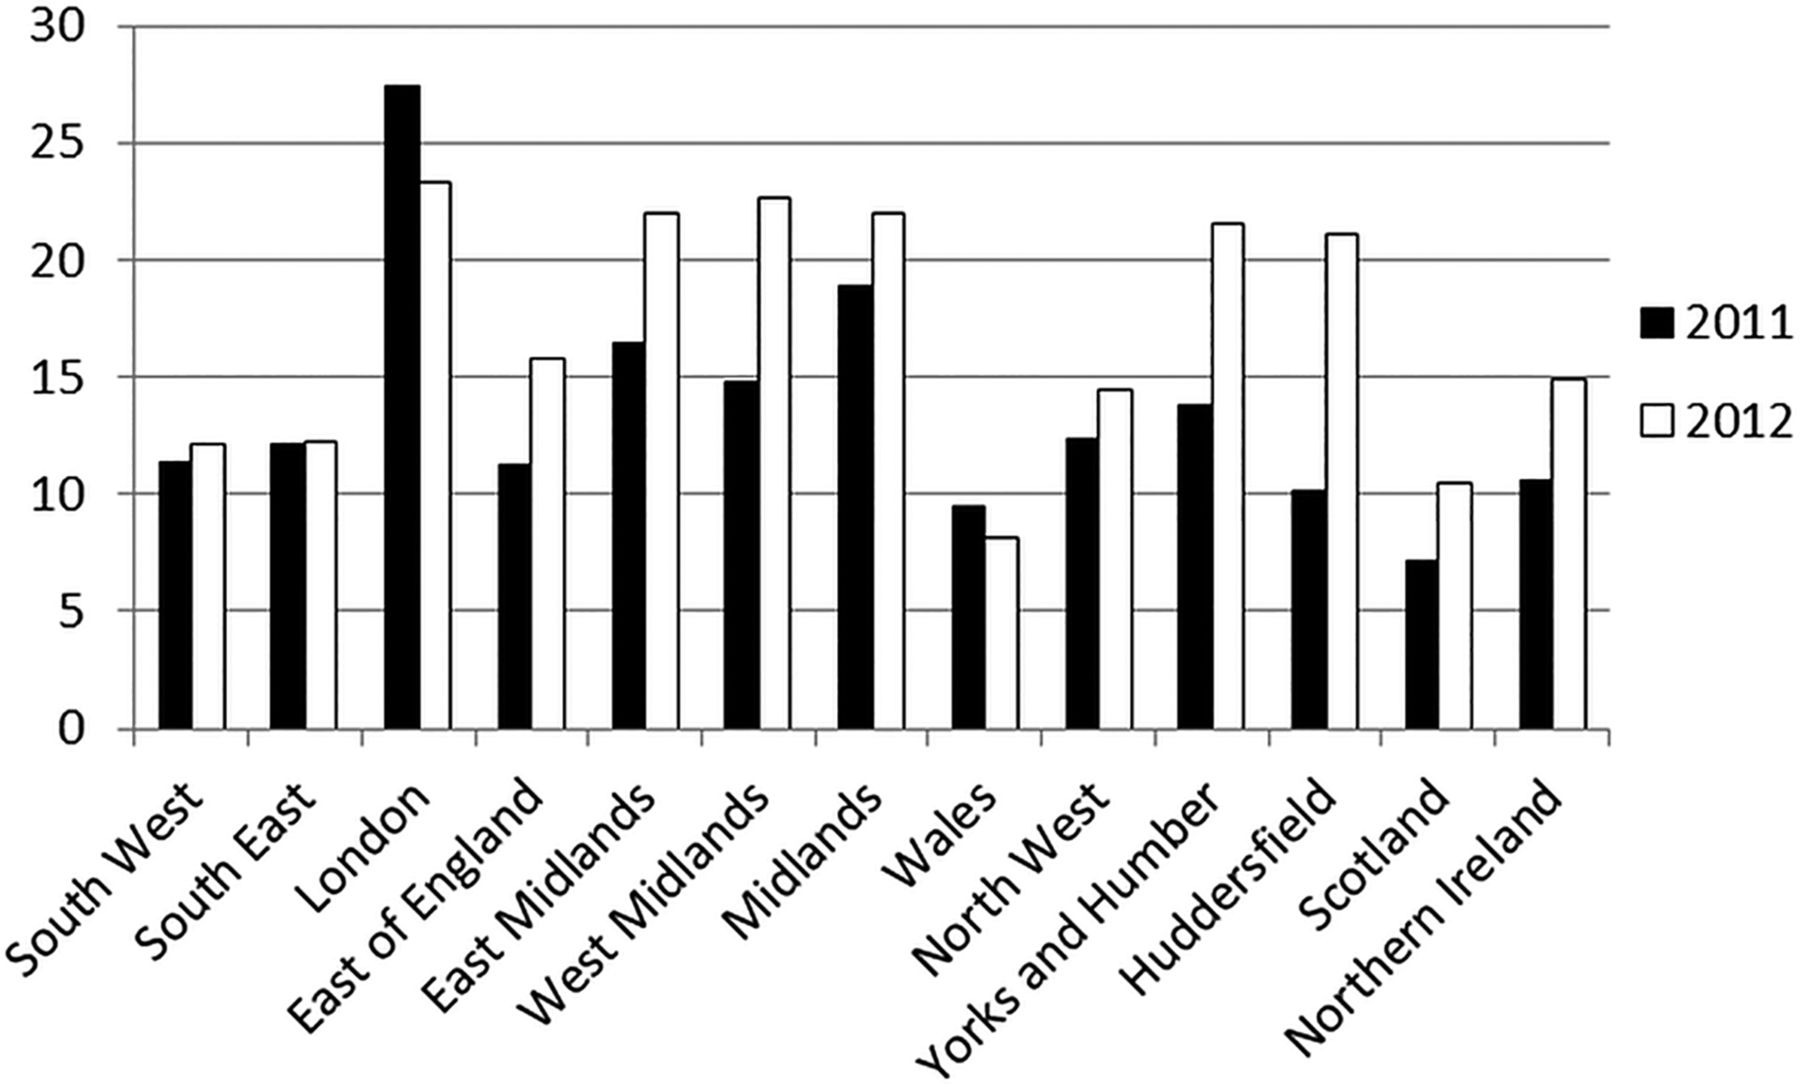
For almost all parts of the UK where repeat data were available, the press articles show an increase, often quite marked, in levels of illicit/NUKDP cigarettes between 2011 and 2012 (figure 3). Comparing national data from the press articles is more difficult as there are numerous estimates, but articles citing national data reaffirm this message (figure 3),94 ,102 as do quotes such as Colin Wragg, head of corporate and legal affairs at IMT, saying, ‘The illicit tobacco trade continues to increase, benefiting no one but the criminals involved’.116

Trends in ‘illicit’ *cigarettes based on press articles citing industry data for 2011 and 2012 (proportion of total consumed). Source: from press articles where repeat data are available over time for the same geographic area either in the same or separate articles.71 ,73 ,74 ,78 ,92 ,95 ,97 ,101 ,102 ,105 ,116–118 ,120 ,124 Note: As outlined in the text, articles do not specify whether the data cited refer to Non-UK Duty Paid (NUKDP) or illicit but give the impression they refer to illicit while almost certainly referring to NUKDP. *Other UK figures for 2012 range from 16% 109 to 27%.104 **Other figures for 2011 in London range from 20% to 33%.121
Formally published industry data
National data
Formally published data show a consistent downward trend in NUKDP cigarettes between 2006 and 2011 (figure 4). Industry data (other than those from the TMA) and HMRC estimates of NUKDP are broadly similar over this period. TMA estimates, by contrast, are considerably higher – between 8 and 12 percentage points higher than HMRC estimates over this period - while the only other independent estimate (PPACTE, which covers England rather than UK) is considerably lower at 8.1% in 2010.20

Tobacco industry and independent estimates of Non-UK Duty Paid cigarettes as a share of total consumption in the UK market, 2006–2012. Note: * 2012 KPMG estimates are based on a cigarette basis, whereas previous years’ data were based on a pack basis. Cigarette-based estimates are likely to lead higher estimates in the UK (see text). Her Majesty's Revenue and Customs (HMRC) data for 2010–2011 are coded here as 2011, data for 2009–2010 as 2010, etc. Pricing Policies and Control of Tobacco in Europe data refer to England rather than the UK. Source: JTI Pack Swap Survey as cited in Project Star 2011 report. TMA Empty Pack Survey (EPS) data as cited in Project Star 2011 report. PMI EPS data as cited in Project Star 2012 report (p. 199). (For 2011 and 2012, the figure presented is the average of 2 given for quarters 2 and 4 of the year.) HMRC data from Measuring Tax Gaps Tables, 2012 (Table 4.3): (we added cross-border shopping to illicit estimates) http://www.hmrc.gov.uk/statistics/tax-gaps.htm#3. HMRC data from Measuring Tax Gaps Tables, 2013: http://www.hmrc.gov.uk/statistics/tax-gaps/mtg-table2013.xls.
From 2011, industry and HMRC data differ markedly. The two industry sources available beyond 2011 both show a sudden, large increase in NUKDP that counters the previous trend. However, methodological details in Project Star indicate that the methodology changed in 2012 from a pack-based to a cigarette-based measure such that the 2012 estimate will be higher than previous estimates.62 This is due to the fact that packs of 10 cigarettes are available on the UK market and the average domestic pack size is therefore under 20 cigarettes while non-domestic packs contain 20 cigarettes.62 By contrast, HMRC data show a continuing decline in NUKDP to 2011–2012. HMRC has not yet released NUKDP data for 2012–2013, although we note that its estimate of illicit in 2012/2013 is 9%, which compares with 7% in 2011/2012 and 9% in 2010/2011.49
Regional data
For all regions other than London and Wales, JTI's The Billion Pound Drop data show an increase in NUKDP cigarettes between 2011 and 2012 (figure 5).

In contrast, independent data show continued declines in illicit and NUKDP (table 2). For the southwest, independent data show a decline in the proportion of NUKDP cigarettes from 18% in 2010 to 10% in 201366 compared with an increase from 11% to 12% in industry data between 2011 and 2012. Although the other independent and industry data are not directly comparable—industry data measuring NUKDP cigarette penetration and independent data measuring illicit penetration (tobacco—ie, cigarettes and RYO combined—in the northeast and tobacco and cigarettes in the southwest), the differing trends are still apparent.
Estimates of NUKDP or illicit cigarettes/tobacco as a proportion of total volume, 2009–2013, in the northeast and southwest of England based on tobacco industry (The Billion Pound Drop) and independent (NEMS) survey data
For example, independent data on penetration of illicit tobacco show declines from 15% in 200969 to 9% in 201370 in the northeast, and from 11% in 2010 to 7% in 2013 in the southwest.66 Levels of cross-border sales (which account for the difference between illicit and NUKDP) have not changed significantly in recent years and cannot therefore account for the differing trends and the growing disparity between industry and independent data.125 ,126
Industry reporting of HMRC data
In each of the four instances that JTI cited HMRC data in The Billion Pound Drop report, it cited HMRC's upper limit (or a secondary report using this upper limit) rather than the, more likely, mid-estimate without explaining this misrepresentation (table 3). In one instance, it claimed to be using 2011/2012 HMRC data, which were not available then.
JTI's use of HMRC data in its The Billion Pound Drop report24
Discussion
A number of findings are noteworthy. First, our findings suggest that the TTCs have deliberately sought to solicit press coverage on the illicit tobacco trade in the UK using their EPSs. Press coverage started just 3 months after the government committed to examine SP, peaked in March 2012, just prior to the consultation, and again in late 2012 following the consultation, a period when discussions about whether to proceed with SP were taking place.
Second, the press coverage and recently published industry data appear intended to stress that levels of illicit are high and, in contrast to independent data, increasing rapidly. Almost all the press coverage detailing trends indicated that the market share of NUKDP/illicit cigarettes increased between 2011 and 2012 (figure 3). Two sets of formally published industry data from JTI24 and PMI62 also show increases in NUKDP cigarettes nationally and in almost all regions (figures 4 and 5).
Yet this apparent increase is not seen in two independent data sources, which instead indicate that levels of illicit and NUKDP continued to decline to 2013.70 The sudden increase, identified in industry data in 2012, stands in marked contrast to the downward trend previously identified in all available industry and independent data (figure 4). While there is a small increase in the HMRC illicit estimate for 2012–2013, this is not close to the magnitude of the increases depicted in the industry data and press stories.
A third key finding was the absence of detail on the methodologies underlying TTC data. Only four of the press stories could be linked to published industry data, JTI's The Billion Pound Drop report,24 which provides no methodological details. While PMI's Project Star reports are the only industry source that provides some methodological information, its limitations have previously been outlined.20 These methodological details show that the 2012 Project Star data cannot be directly compared with the 2011 data as a methodological change, from a pack-based to a cigarette-based measure, instigated in 2012 will provide an artificially higher estimate compared with previous years.62 This information was hidden in a tiny footnote on page 199 of the report, which had to be read in conjunction with a methodological appendix on page 215. It was not detailed in PMI's press release,128 which drew attention to the ‘increase’ in illicit in the UK. This could be interpreted as a deliberate effort to mislead.
This leaves a single tobacco industry report—JTI's The Billion Pound Drop report24—showing an increase in NUKDP in 2012. With no methodological details, it is difficult to assess the data's veracity. We do show, however, that this report systematically misreports HMRC data, in each instance using HMRC's upper estimate as if it is the only and most likely estimate. This is consistent with an Advertising Standards Authority ruling that a series of adverts JTI placed in national newspapers in September 2012 suggesting that SP would increase the illicit trade were misleading as that the tobacco company could not claim that ‘the black market in tobacco is booming’, nor that the UK had suffered ‘£3 billion lost in unpaid duty last year’, because the figure was on the upper limit of the HMRC range.129
Potential limitations to our study should be considered. First, although we can document the timing and number of press articles citing tobacco industry data, we cannot prove the TTCs’ intent or role in generating these stories. Our findings are, however, consistent with recently leaked PMI documents that indicate that this was a deliberate campaign: the claim that SP ‘would increase illicit trade’ was one of four main arguments PMI planned to use against the policy.130 The leaked documents also talked of ‘using’ the company's 2011 EPS results as part of a media campaign.130 The fact that PMI published its 2012 Project Star report in April 2013, just prior to the announcement of the government's legislative agenda in May 2013, rather than in the summer when previous reports had been published, also suggests a deliberate effort to influence ministerial decisions. Second, we only examined newspaper coverage. However, the industry also promotes the illicit argument on social media. A brief review of @BATPress tweets from 1 November to 4 December 2013 showed that over a quarter (21 of 77) tweets focused on illicit.
The second main shortfall in our study is that both sets of independent regional data66–70 come from surveys by the same organisation and only one provides data directly comparable with industry data. Although industry data measure NUKDP, while most of the independent data measure illicit, we show that, nationally, levels of cross-border sales have changed very little over this period and are therefore very unlikely to explain the increase seen in industry data.
Our findings are consistent with a growing body of evidence raising major concerns about industry data on illicit tobacco.20 ,29 ,53 ,131 This evidence suggests that industry estimates of illicit are routinely higher than independent estimates.20 ,29 ,53 ,131 A comparison of industry EPS data with data from two academic surveys—an EPS and a survey collecting packs directly from smokers—showed that industry estimates of non-domestic packs exceeded both academic estimates by at least 47%, while the two academic estimates were statistically indistinguishable.53 Importantly this study also suggests that surveys asking smokers about their habits will not underestimate illicit. A comparison of PMI's Project Star illicit cigarette estimates, also based on EPSs, with an independent pan-European survey using self-reporting combined with pack inspections to estimate illicit, shows that industry estimates were generally higher and in some instances markedly so.20
These discrepancies likely relate to problems with industry EPS methodologies. Although, when properly conducted EPSs can provide useful data on non-domestic product,53 ,132 this study, like others,20 ,53 finds that industry methods are rarely fully disclosed. Moreover, the limited instances where information on methodology is available raise major concerns. Researchers examining an industry EPS in Germany, for example, suggest it systematically over-represented regions along the border and around US military bases where use of non-domestic product would be greater, arguing that the study ‘seems to pursue the aim of showing an exaggerated high amount of illegally imported cigarettes’.54
The UK TMA surveys, which we show (figure 4) provide considerably higher estimates of NUKDP than other surveys, are reported to be based on packs collected at sports events,20 specifically at Liverpool Football Club matches and the Newcastle race course.132 PMI's Project Star report suggests that PMI's EPSs do not use appropriate sampling methods (eg, random selection of areas using probability proportional to size as described in Merriman)132 with surveys only undertaken in the largest cities and often conducted by those with a vested interest. These issues may lead to an overestimate of illicit.20
Other evidence supports our contention that the recent increase in NUKDP/illicit cigarettes in the UK is unlikely to be genuine. In Australia, almost identical industry claims about trends in illicit were made during government consultations over SP. A report by accountancy firm Deloitte34 prepared for the three large Australian cigarette firms claimed the market share of illegal cigarettes had increased from 6% in 2007 to 16% in 2010. By contrast, independent data suggested it was steady at 3%.133 The fact that consumption of legal cheap cigarette brands, the closest competitor to illicit, was steady also suggested that the claimed increase in illicit was highly unlikely.29 In the UK, a clear upward trend in the market share of ultra-low-price cigarettes,134 the closest competitor to illicit cigarettes, similarly casts doubt on industry data.
Conclusions
This study indicates that industry data on levels of illicit should be treated with extreme caution. TTCs are exaggerating the threat of illicit tobacco by commissioning surveys whose methodology and validity remain uncertain, planting misleading stories and misquoting government data. Industry claims that use of NUKDP/illicit cigarettes in the UK is increasing rapidly is inconsistent with historical trends, recent independent data and with increases in the market share of the cheapest legal cigarettes. In the UK, these claims form part of industry efforts to derail plans for SP, but similar data and arguments are being used to counter other policies including in other jurisdictions.27 ,28 ,30 ,31 ,130
In light of ours and others’ evidence that industry data on illicit are unreliable and likely to exaggerate the scale of the problem, governments should be extremely cautious about collaborating with industry to obtain data on illicit tobacco and relying on such data as is occurring in a number of jurisdictions.28 ,53 ,135 TTCs should be required to make their underlying methodologies public to verify whether the data measure non-domestic or illicit product and all industry data should be subject to expert external peer review before being made public. Journalists should be made aware of the misleading nature of tobacco industry data. Our findings also highlight the need for timely independent data on the scale of the illicit tobacco trade.
What this paper adds
-
This is the first paper to analyse tobacco industry manipulation of data on the illicit cigarette trade in the UK.
-
An analysis of newspaper articles over 5 years reveals that, shortly after the possibility of standardised packaging was announced, the tobacco companies began and have subsequently continued, placing stories in the press that exaggerate the extent of illicit penetration in the UK, by confusing Non-UK Duty Paid (NUKDP) cigarettes with illicit.
-
These press stories and recent formally published industry data suggest that illicit/NUKDP is rising sharply. In contrast, independent data show steady declines in non-domestic and illicit cigarette penetration from 2006 to 2012 and either a continued decline or small increase to 2013.
-
Tobacco companies are exaggerating the threat of illicit tobacco as part of a public relations strategy to undermine public health measures such as standardised packaging. Their data and claims should be treated with extreme caution.
References
Footnotes
-
Contributors ABG and AR conceived the idea for the study, analysed the press coverage, industry and independent data, and wrote and edited the paper. AR collated the data. KE-R analysed the reporting of HMRC data in The Billion Pound Drop report and edited the paper. All authors approved the final version.
-
Funding This work was supported by grant number RO1CA160695 from the US National Cancer Institute. The underlying industry monitoring that informed the need for this more detailed study is funded by Cancer Research UK, grant no. C48078/A16481. ABG and AR are members of the UK Centre for Tobacco Control Studies (UKCTCS), a UK Centre for Public Health Excellence. Funding to UKCTCS from the British Heart Foundation, Cancer Research UK, the Economic and Social Research Council, the Medical Research Council and the National Institute of Health Research, under the auspices of the UK Clinical Research Collaboration, is gratefully acknowledged. The funders played no role in the study design, analysis and interpretation of data, nor writing of the report or the decision to submit the article for publication.
-
Competing interests None.
-
Provenance and peer review Not commissioned; externally peer reviewed.
-
Data sharing statement The data are available upon request.