Article Text

Abstract
OBJECTIVE To examine whether eliminating smoking will lead to a reduction in the number of years lived with disability (that is, absolute compression of morbidity).
DESIGN Multistate life table calculations based on the longitudinal GLOBE study (the Netherlands) combined with the Longitudinal Study of Aging (LSOA, United States of America).
SETTING the Netherlands.
SUBJECTS Dutch nationals aged 30–74 years living in the city of Eindhoven and surrounding municipalities (GLOBE) and United States citizens age 70 and over (LSOA).
MAIN OUTCOME MEASURES Life expectancy with and without disability and total life expectancy at ages 30 and 70.
RESULTS A non-smoking population on balance spends fewer years with disability than a mixed smoking-non-smoking population. Although non-smokers have lower mortality risks and thus are exposed to disability over a longer period of time, their lower incidence of disability and higher recovery from disability yield a net reduction of the length of time spent with disability (at age 30: −0.9 years in men and −1.1 years in women) and increases the length of time lived without disability (2.5 and 1.9 years, for men and women, respectively). These outcomes indicate that elimination of smoking will extend life and the period of disability free life, and will compress disability into a shorter period.
CONCLUSIONS Eliminating smoking will not only extend life and result in an increase in the number of years lived without disability, but will also compress disability into a shorter period. This implies that the commonly found trade off between longer life and a longer period with disability does not apply. Interventions to discourage smoking should receive high priority.
- smoking
- morbidity
Statistics from Altmetric.com
Today, the aim of science and medicine is more to reduce the number of years that people spend diseased or disabled than to lengthen life.1 Evidence is mounting that smoking is not only a major preventable factor associated with mortality,2 3 but also with disability.4-8Although a large body of evidence supports the claim that not smoking extends the length of life,2 9 it is not certain whether not smoking also reduces the number of years spent with disability. Given the fact that non-smokers live longer, these extra years may be accompanied by an increased burden of disability. After all, survivors age and increasing age is strongly associated with chronic diseases and disability. Hence, whether eliminating smoking will on balance result in a reduction of the length of time lived with disability, depends on whether or not the fewer number of years with disability attributable to lower risks of disability are counterbalanced by the rise in the number of years with disability attributable to improved chances of surviving to older age.
We used a multistate life table to estimate the effect of not smoking on total life expectancy and life expectancy with and without disability, taking into account the fact that smoking causes both excess disability and mortality. The central question is whether eliminating smoking will lead to a reduction in the number of years with disability (that is, compression of morbidity).
Methods
SOURCE OF DATA
The primary data source used was the GLOBE study—GLOBE being the Dutch acronym for Health and Living Conditions of the population of Eindhoven and surroundings. A detailed description of the sample and design is given elsewhere.10A postal questionnaire was sent in 1991 to an aselect sample of approximately 27 000 Dutch nationals aged 15–74 years living in the city of Eindhoven and surrounding municipalities (response rate 70.1%). Persons living in institutions were included in this sample, except for the city of Eindhoven (40% of all respondents), where homes for the elderly were the only institutions that could be included. Two sub-samples of the postal survey were approached for an additional oral interview. The first sub-sample was formed by a group that was taken at random from respondents of the postal survey (3529 persons). The response rate of this oral interview was 79.3% (2800 respondents). In the second sub-sample (also taken from respondents of the postal survey), chronically ill persons were oversampled (3970 respondents). To increase the power of our study, we also included the second sub-sample. The response of the oral interview of this second group was 72.2% (2867 respondents). In the follow up, respondents of both sub-samples of the 1991 oral interview (5667) received postal questionnaires in 1993 (n=4496, that is, 79.4%; 81.1% after correction for mortality) and 1995 (n=4105, that is, 72.4%; 76.4% after correction). As mortality is an outcome of interest, persons who died were not considered as “lost to follow up” and were included in the corrected response rate. Information on mortality was based on municipal population registers, disability status was assessed in each wave, and smoking status was based on the postal questionnaire of 1991. Smoking status was classified as “current smokers” and “non-smokers”. We did not use a reference group of persons who had never smoked in order to avoid small numbers and bias resulting from the considerable misclassification of former smokers as persons who had never smoked, which reportedly is common in survey data.11Persons under age 30 (n=659) and persons of whom the vital status at follow up was unknown (less than 0.3%) were excluded from the analyses. Persons were considered to be disabled if they were living in an institution or indicated that they needed help or were unable to perform without (great) difficulty one or more activities of daily life, mobility and communication that are essential for independent functioning. In 1991, the complete set of questions on disability was presented to only 2867 subjects (second sub-sample). Complete information on disability and vital status at the beginning and end of a two year interval was available on 1988 persons in the period 1991–1993 and on 3119 persons in the period 1993–1995, yielding a total of 5107 observations.
As GLOBE did not comprise persons above age 74 in 1991 and a substantial part of the possible mortality and disability reduction attributable to smoking elimination may occur beyond age 75, a second data source, the Longitudinal Study of Aging (LSOA)12was used. The LSOA started in 1984 with interviews of 7527 non-institutionalised persons of age 70 and over in the United States of America. Subjects who were institutionalised during the study were included in the follow up. The complete sample was reinterviewed in 1988 (n=4984, 66.2%; 89.0% after correction for mortality) and 1990 (n=4142, that is, 55.0%; 87.4% after correction), while a sub-sample of 5151 persons was reinterviewed in 1986 (n=4113, that is, 79.8%; 92.4% after correction). Disability status was assessed in each wave in a similar way as in the GLOBE study, and information on mortality was based on the National Death Index. Smoking status was not assessed in LSOA. Full details on the sample and design are given elsewhere.13 Non-whites (n=647) and persons of whom the vital status at follow up was unknown (less than 0.4%) were excluded from the analyses. Complete information on disability and vital status was available for 3720 persons in 1984–1986, 2853 in 1986–1988 and 3535 in 1988–1990, yielding a total of 10 108 observations.
STUDY DESIGN
Firstly, we examined whether the two datasets could be joined and whether they would together describe the Dutch situation by comparing the proportion of persons who died and the proportion of disabled persons by age between GLOBE, LSOA and national representative data sources.14-16 As these conditions were met, except for a small jump in the prevalence of disability between LSOA and GLOBE in men, and lower proportions of women who died in LSOA (most likely because of the underrepresentation of the insitutionalised population)17 we pooled all observations. We estimated incidence rates of disability, recovery rates from disability and mortality rates among non-disabled and disabled persons for the current mixed smoking-non-smoking population, using Poisson regression analysis. This method is also known as log linear regression with offset.18 The number of persons at risk, used as rate multiplier in the regression analysis, was adjusted for the sampling design in LSOA and for the overrepresentation of people with a chronic disease in the second sub-sample in GLOBE. An adjustment was also made for persons for whom the disability status was unknown at the beginning or end of the interval, but who were known to be alive. The equations used to describe the relation with age and the estimated parameters are given in the . We used the multistate life table, which is an extension of the standard life table,19 to estimate life expectancy with and without disability for the current mixed population on the basis of these age specific incidence, recovery and mortality rates. The close agreement between model estimates of total life expectancy, as well as outcomes of more detailed validity checks (see Discussion section) induced us to consider the estimated multistate life table model to represent the Dutch situation.
Next, the incidence, recovery and mortality rates among non-disabled and disabled persons were estimated for non-smokers to calculate life expectancy with and without disability after smoking elimination. These rates for non-smokers were estimated from the rates in the mixed population, combined with data on the percentage of smokers and non-smokers in the mixed population20 (table 1), and data on the association between smoking and incidence, recovery and mortality among non-disabled and disabled persons (expressed as rate ratios) (see ). The data on the rate ratios, controlled for age and sex, were originally estimated from GLOBE using Poisson regression (table 2). Because the rate ratios did not differ significantly by age and sex, except for the significantly lower rate ratios of incidence in men (1.35) compared with those in women (2.35), we used the same rate ratios for both sexes and all ages. A combination of the same rate ratios of incidence, recovery, and mortality among non-disabled and disabled persons for all ages is consistent with declining relative risks on total mortality with increasing age as observed in literature.2 3 The rate ratio of total mortality was substantially higher than the rate ratios of mortality among non-disabled and disabled persons (table 2), because the higher incidence risks and lower recovery risks of smokers, combined with the excess mortality risks in the disabled state also contributed to the difference in total mortality between smokers and non-smokers. As the rate ratios of mortality did not differ significantly between non-disabled and disabled persons, we used the same rate ratios for both health states. Although this association did not reach statistical significance, we used the—statistically insignificant—rate ratio of 1.24 (95%CI: 0.87, 1.76), because the small number of deaths in GLOBE might have been the principal cause of this statistically non-significant outcome. In addition, underestimating the association between smoking and mortality might artificially produce compression of morbidity when smoking is eliminated.
Percentage of smokers in the Netherlands, 1991, by age and sex20
Rate ratios of transitions for smokers as compared with non-smokers (corrected for age and sex), GLOBE, the Netherlands
The rate ratio of incidence of 1.79 (95% CI 1.46, 2.19) fitted well within the range of reported rate ratios in previous studies.5-8 The rate ratio of total mortality of 1.6 (30–75 years), 1.45 (76–84 years) and 1.3 (85+ years) was also in line with the results from other European studies,2 21considering that former smokers were included in the reference group. To our knowledge, no information is available on the association between smoking and recovery, and between smoking and mortality by disability status (non-disabled and disabled). Nor can this information be easily derived from data on the association between smoking and total mortality.
Finally, we compared the life expectancy with disability between the mixed smoking-non-smoking population (baseline) and the non-smoking population (after eliminating smoking) to determine whether eliminating smoking will reduce the number of years that people spend in a disabled state—that is, whether absolute compression of morbidity will occur. To assess whether the effects of smoking elimination differ by age, we calculated life expectancy with and without disability for persons aged 30 and 70. Although these persons are on average 30.5 and 70.5 years old, in the presentation of the results, we used age 30 and 70, respectively.
SENSITIVITY ANALYSES
In a first set of sensitivity analyses, we assessed the sensitivity to uncertainties induced by pooling data of the GLOBE and LSOA study. Previous examinations of the comparability of both datasets and the representativeness of the outcomes for the Dutch situation indicated that two uncertainties might have biased the estimates of the transition rates: (1) a possible underestimation of persons in institutions because of sampling design in LSOA and (2) a small jump in the proportion of men with disability between GLOBE and LSOA at age 70, which might have biased the estimate of the incidence rates in men.17 We examined in the first variant the sensitivity of the outcomes for the underrepresentation of elderly living in institutions. In this variant we used higher mortality rates among disabled and lower recovery rates (change: 76–85: 10%; 86–95: 20% and 96+: 30%). In a second variant we examined whether the small jump in incidence of disability in men between GLOBE and LSOA has affected the outcomes. In contrast with the main analyses, we used for the estimation of the incidence rates the parameter for the level (that is, α) based solely on GLOBE.
In a second set of sensitivity analyses, we tested the sensitivity of the analysis to different values in the rate ratios, by recalculating the life tables with excess risks that were 50% higher and 50% lower. In this way sensitivity margins were calculated with the upper and lower bounds of the rate ratios.
In a third set of sensitivity analyses, we assessed the sensitivity to specific uncertainties related to the value of one or more rate ratios. We specified five additional variants, to assess the uncertainty related to (1) the lack of evidence from other studies on the association between smoking and recovery, (2) the absence of a significant association between smoking and mortality among non-disabled and disabled persons, (3) the possible confounding of the association between smoking and incidence, recovery and mortality among disabled and non-disabled persons, when smokers have quit smoking because of a chronic condition, (4) the sex difference in the rate ratio of incidence and (5) the possible reduced excess risks in the elderly population. In the first variant, we used a rate ratio of one for recovery (ceteris paribus) whereas in the second variant we used a rate ratio of one for mortality among non-disabled and disabled persons (ceteris paribus). In the third variant, persons who reported to have (had) serious heart diseases, cancer, diabetes mellitus, stroke, chronic obstructive lung disease (COPD) or cancer at baseline were excluded in the estimation of rate ratios. In the fourth variant, we used a rate ratio for incidence of 1.35 in men and 2.35 in women (ceteris paribus). In the last variant, we used 50% lower excess risks above age 70 for all transitions.
Results
key points
-
Smoking is a major preventable factor associated with mortality and disability.
-
Not smoking increases life expectancy and the length of time spent without disability.
-
Despite the fact that non-smokers are exposed to the risk of disability over a longer period of time, not smoking reduces the length of time spent with disability.
-
The results provide a strong additional argument to discourage smoking.
Figure 1 shows that at each age the prevalence of disability is lower in the non-smoking than in the mixed smoking-non-smoking population. The reason is that non-smokers have a lower incidence of disability and a higher recovery from disability (table 2).
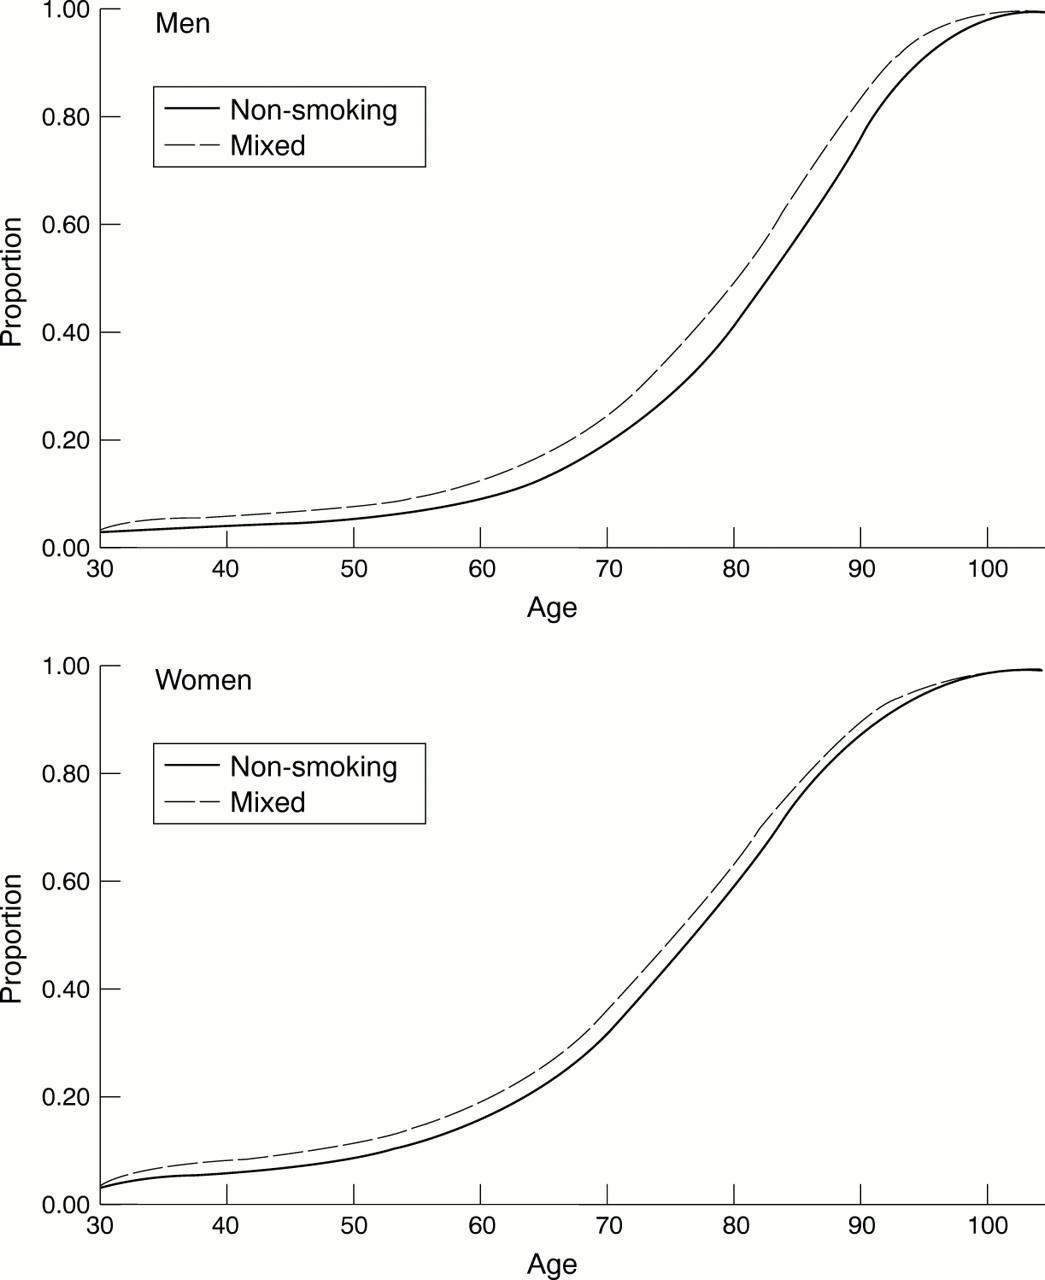
Prevalence of disability by age in the non-smoking and mixed (smoking/non-smoking) population based on the multistate life table.
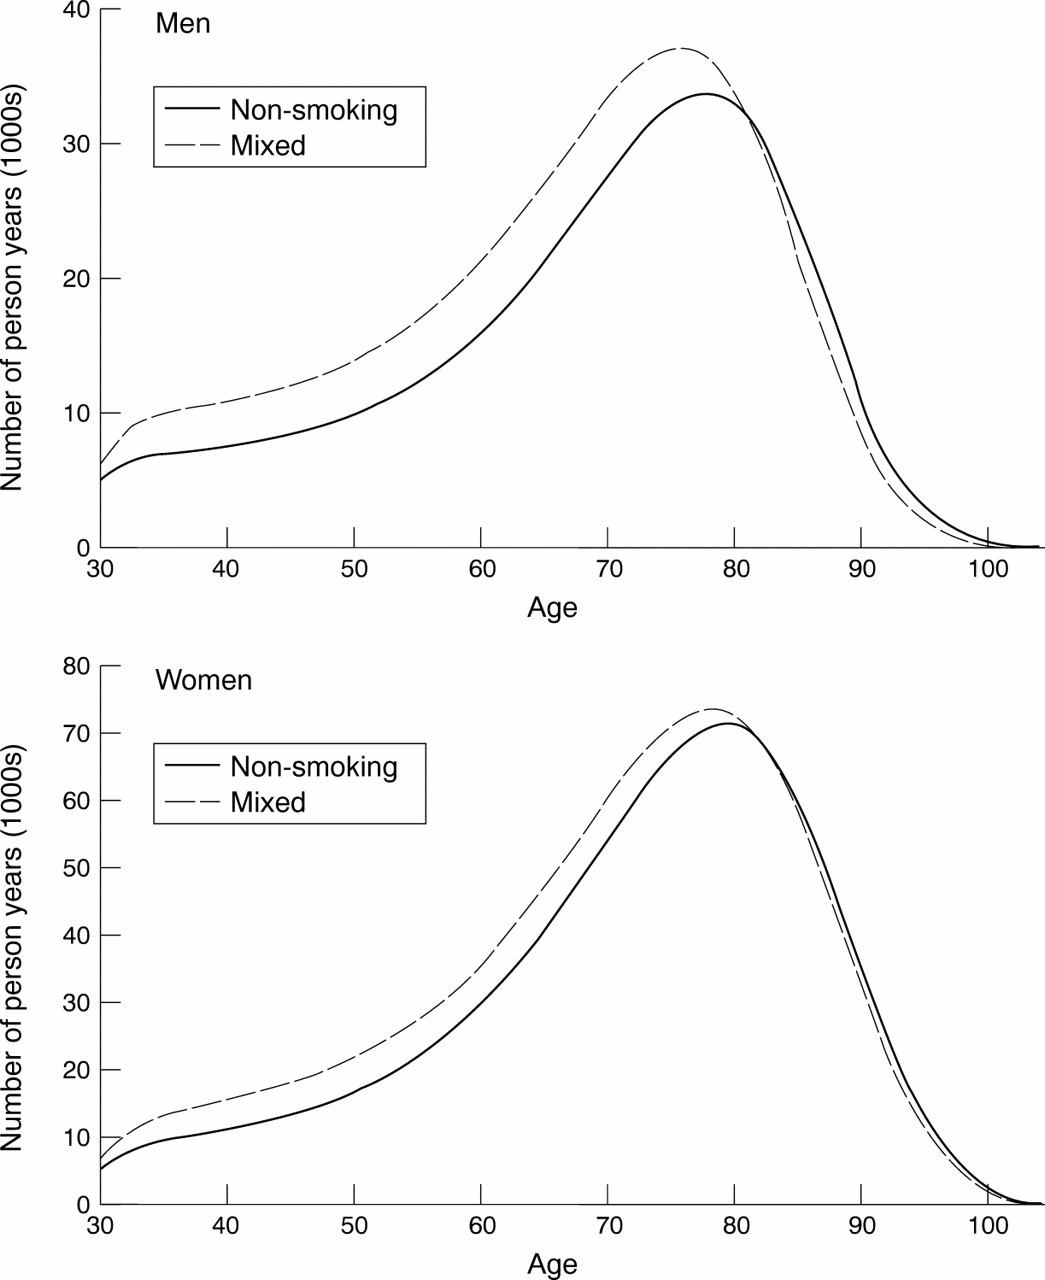
To assess whether non-smoking reduces the number of disability years, the lower mortality risks and thus the longer period in which non-smokers will be exposed to disability should be considered as well. By looking at (changes in) the number of person years with and without disability (by age) and life expectancy with and without disability (summarised across ages)—both outcomes of the multistate life table—it is possible to take into account the effects of changes in disability and mortality at the same time. Figure 2 shows that at younger ages the number of person years with disability is smaller in the non-smoking population than in the current mixed population, whereas at older ages the opposite is true. On balance, life expectancy with disability at age 30 is lower in the non-smoking than in the mixed population (table 3). In the mixed population, total life expectancy at age 30 is 44.8 years (men) and 50.8 years (women), of which about 38.5 years without disability and respectively 6.4 and 12.4 years with disability. In the non-smoking population total life expectancy is 46.4 (men) and 51.6 years (women), of which 41.0 and 40.3 years, respectively, without disability and 5.5 and 11.3 years, respectively, with disability. These results indicate that elimination of smoking will produce a substantially larger gain in disability free life expectancy (2.5 years in men and 1.9 year women) than in total life expectancy (1.6 and 0.8 years respectively). Consequently, smoking elimination will reduce the number of years with disability (−0.9 and −1.1 years respectively). This reduction in the number of years with disability indicates that absolute compression of morbidity will occur. At age 70, the effects of elimination of smoking were in the same direction, but smaller.
Number of person years with disability by age in the non-smoking and mixed (smoking-non-smoking) population based on the multistate life table.
Total life expectancy (LE), disability free life expectancy (DFLE), life expectancy with disability (LED) and percentage of life with disability of the mixed smoking-non-smoking population (baseline) and of the non-smoking population (after elimination of smoking), the Netherlands3-150
Table 4 shows that the conclusion on compression of morbidity was not affected by the probable underrepresentation of the institutionalised population, nor by using lower incidence rates in men based on the GLOBE study. In addition, the outcomes were not very sensitive to different values in the rate ratios associated with smoking. Using 50% lower or higher excess risks did not change the conclusion. Finally, using rate ratios of one for recovery (ceteris paribus), for mortality among non-disabled and disabled persons (ceteris paribus), or excluding in the estimation of the rate ratios persons who reported to have (had) a serious chronic disease at baseline, did not change the conclusion. Nor did using 50% lower excess risks for all transitions at age 70. Only in the unlikely situation that the association between smoking and incidence of disability is substantially weaker in men, while the other associations are not, will virtually no compression of morbidity above age 70 occur (data not shown for age 70).
Change in life expectancy with disability (LED) at age 30 because of smoking elimination (sensitivity analyses)4-151
Discussion
This study evaluated whether eliminating smoking would produce compression of morbidity into a shorter period, by comparing life expectancy with disability in the current mixed smoking-non-smoking population (baseline) and in the non-smoking population (after smoking elimination). Our results show that on balance non-smokers spend fewer years with disability than the mixed smoking-non-smoking population. Although non-smokers have lower mortality risks, and are thus exposed to disability over a longer period, their higher ability to maintain health and to restore health losses results in a net reduction of the length of time spent with disability and in an increase in the life time free of disability. These outcomes indicate that eliminating smoking will extend the length of life and the length of disability free life, and will compress disability into a shorter period.
Previous studies on the effects of smoking have reported that smoking increases the risks of several chronic diseases, such as (lung) cancer, heart disease, stroke, and chronic obstructive lung disease.3 These diseases are significantly associated with mortality2 3 and most of them with disability.22-24 This implies that an effect of smoking on disability and mortality is biologically plausible. Nevertheless, there are still important gaps in our understanding of the mechanisms through which smoking affects disability and mortality. Smoking may have an effect on disability and mortality by increasing disease incidence, decreasing disease recovery, increasing disease severity or by increasing the incidence of comorbid conditions. In addition, physiological losses and symptomatology not operating through specific diseases may have an effect on frailty8 and in turn on disability and mortality. In evaluating the effect of smoking elimination, we used information on the association of smoking with disability and mortality, rather than information on the different diseases and pathways through which smoking affects disability and mortality. This enabled us to take into account the overall impact of smoking without needing information on the exact mechanisms. To better understand the association of smoking with disability and mortality further research is needed to unravel these underlying mechanisms.
The limitations of our study regarding the data should be noted. Firstly, we used data from two different countries to estimate the transition rates between the different health states and to death. Moreover, persons living in institutions were underrepresented in these data because of the sampling design, especially in the LSOA. At different stages in the research process, we examined the consequences of pooling the GLOBE and LSOA dataset. Firstly, we examined whether significant discontinuities existed between the two datasets in the proportions of persons who died and the proportions of persons with disability, and whether the two datasets described the Dutch situation.14 16 We found that the two datasets showed no substantial discontinuities, except the smaller proportion of disabled men in GLOBE. With the exception of the smaller proportions of persons dying at older ages in LSOA (especially in women, most probably reflecting the underrepresentation of the institutionalised population) the datasets described the Dutch situation. Next, we examined whether the transition rates estimated from these datasets differed between the two studies regarding the level (α) and increase with age (β). We found a difference in the level of incidence in men, reflecting the difference in the proportion disabled, and a difference in the level of mortality among disabled women, reflecting the underestimation of mortality in elderly women. Finally, we examined whether the outcomes of the multistate life table model based on these transition rates reproduced the Dutch situation. As could be expected, age specific mortality rates derived from the multistate model were underestimated in women above age 85. Nevertheless, survival curves were very similar to those based on national mortality from Statistics Netherlands and total life expectancy at age 30 and age 70 differed less than 0.3 year in both sexes. The agreement between the prevalence of disability by age based on the multistate model and the external data sources was also rather close. Thus, apart from the underestimation of the institutionalised population in the LSOA and the possible overestimation of incidence in men, we found that the two datasets could be joined and together described the Dutch situation. As, in addition, sensitivity analyses showed that our conclusion was robust to these two factors, we considered the outcomes to be valid.
Secondly, we used the same rate ratios at all ages. Although evidence exists that rate ratios of total mortality for smokers as compared with non-smokers decrease with increasing age,2 3we do not know studies showing a decline in the rate ratios of incidence, recovery and mortality by disability status with increasing age. We examined whether interactions were present between age and smoking within the limited age range of the GLOBE study (30–74 years), but did not find any significant interactions. Moreover, using the same rate ratios of incidence, recovery, and mortality among non-disabled and disabled persons for all ages produced declining rate ratios on total mortality with increasing age as observed in literature.2 3 However, when in reality rate ratios of incidence, recovery and mortality by disability status do decrease with increasing age, our outcomes might still be biased. Such a bias is to be expected when the excess risks for disability but not for mortality are lower at older ages. We consider it more probable that if excess risks associated with smoking are lower at older ages, this decline would affect all transitions, as we expect that the same pathophysiological mechanisms that cause excess risks of disability for smokers, also cause higher mortality risks. Sensitivity analysis, exploring the effect of lower excess risks for all transitions above age 70, showed that even a reduction of the excess risks by 50% for all transitions would not change our conclusion.
Two other methodological issues affect the interpretation of our outcomes. Firstly, we assumed that elimination of smoking would produce a population that experiences the same incidence, recovery and mortality rates as observed for non-smokers in the current mixed smoking-non-smoking population. This assumption is only valid if the differences between the current mixed smoking-non-smoking and smoking population were solely attributable to smoking. This would imply that the association between smoking and incidence, recovery and mortality rates among non-disabled and disabled persons, reflects a causal relation, and is not influenced by variation in the prevalence of other risk factors or confounded by sociodemographic characteristics. Although more research is needed to validate the magnitude of the causal association between smoking and incidence, recovery and mortality among non-disabled and disabled persons, uncertainty about the exact magnitude of the rate ratios for smoking is not expected to have biased our conclusion. Firstly, sensitivity analyses showed that the conclusion is not very sensitive to different values in the rate ratios associated with smoking within the margin of 50% lower and higher excess risks and in some other situations specified in table 4. Secondly, additional logistic regression analyses indicated that a correction for sociodemographic characteristics and for other life style factors than smoking would change the rate ratios only slightly and within the margins of the sensitivity analyses (results not shown). Thirdly, sensitivity analyses removing the possible confounding of the association between smoking and incidence, recovery and mortality among disabled and non-disabled persons, when smokers have quit smoking because of a chronic condition, showed no change in our conclusion. Finally, rate ratios which could be validated, such as those for the incidence of disability and total mortality, were in line with results from previous studies (see Methods section).
Secondly, the population that will emerge after elimination of smoking is assumed to have the same distribution of persons who never smoked and former smokers, and the same average duration since smoking cessation as the current non-smoking population. That is, some persons never smoked, some quitted smoking long ago and some quit smoking recently. Although even after a long period since smoking cessation, mortality and disability risks will still be higher among former smokers than among never smokers, because only part of the biological damage attributable to smoking is irreversible, persons who quitted smoking longer ago, will have lower excess risks as compared with never smokers than persons who quitted recently.3 25 If all smokers were to quit smoking at the same time, initially the effect on the population's health would be less than estimated in our study, whereas as the time since smoking cessation evolves, the health status of the future non-smoking population might be more favourable than expected from our results. To explore whether our conclusion would be valid in the case of a future non-smoking population in which no one had ever smoked, we increased the excess risks associated with smoking by 75% to obtain a difference in life expectancy between smokers and non-smokers comparable to the difference currently observed between smokers and those who have never smoked.2 Repeating our analysis using these higher excess risks did not change our conclusion. In this situation, the reduction in life expectancy with disability attributable to smoking elimination was −1.4 years in men and −1.7 in women at age 30 and −0.5 and −0.4 years, respectively at age 70.
Compression of morbidity, in the presence of an increasing life expectancy, is generally considered a favourable development of population health. The combination of a compression of morbidity and an increase in life expectancy means that disability free life expectancy increases more than total life expectancy, which implies that years in poor health are being replaced by years in good health. However, a compression of morbidity without an increase in life expectancy should not necessarily be considered a favourable development. A compression of morbidity can be the result of dramatic increase in premature mortality. Nor should an absence of compression of morbidity be generally considered as undesirable. Reduction of premature mortality is socially desirable, even if this implies that people live longer with disability. Nevertheless, is clear that the consequences of smoking elimination as shown in this study are socially favourable. Smoking elimination would not only produce a gain in total life expectancy (1.6 years in men and 0.8 years in women) and in disability free life expectancy (2.5 years and 1.9 years, respectively), but in addition, the number of years with disability would decline (−0.9 and −1.1 years respectively).
A recent study found that non-smoking will increase health care costs,26 which would seem to contradict our conclusion that non-smoking reduces the length of time spent with disability. However, it is entirely possible that because of smoking elimination lifetime costs will increase, while the number of years with disability will decrease. As many diseases, even when they do not cause disability, still generate costs, the increase in costs with increasing age exceeds that of disability. As a result, non-smokers saved from dying incur more costs when they age than that they accumulate disability.27 The finding that smoking elimination will produce compression of morbidity supports a previous study of the effect of non-smoking on the number of disability years28despite differences in data and methodology.
Our results have important implications for public health policy makers and doctors. They show that interventions aimed at eliminating smoking will extend the length of life and will reduce the number of years spent with disability. This is an important finding in view of the trade off often found between longer life and more years with disability. For example, interventions aimed at eliminating fatal diseases, such as cancer and heart diseases, will extend the length of life, but at the same time will extend the period with disability. On the other hand, interventions aimed at eliminating non-fatal diseases will compress disability into a shorter period, but will not extend life.22 A successful smoking intervention will extend total life expectancy, extend disability free life expectancy and reduce life expectancy with disability. Therefore, interventions to discourage smoking should receive high priority. A next step would be to pinpoint other possible interventions that will compress of disability into fewer years. Further research on the disablement process29 might provide clues for factors preventing, slowing down or undoing disability, which can be targeted at in further public health interventions.
Acknowledgments
We wish to thank Lois Verbrugge and Eileen Crimmins for providing information on the Longitudinal Study of Aging.
INCIDENCE, RECOVERY AND MORTALITY RATES FOR THE MIXED SMOKING-NON-SMOKING POPULATION
We used three functions to describe the relation of the incidence, recovery and mortality rates (that is, transitions rates) with age: the exponential model (also known as the Gompertz model), the Gompertz-Makeham model and the Sigmoid model. The Gompertz model is an exponential model, which reflects an exponential decline in the power to oppose destruction or a exponential diminution of the vital force.30 The Gompertz-Makeham model specifies besides the exponential component, a component independent of age—that is, one of chance. This constant term is the Makeham parameter.30Analogous to the extension of the Gompertz model with the Makeham constant, we use an extension of the exponential model, which includes a component independent of age, which specifies the upper boundary of the transition rate. This model is called the sigmoid model, as the curve is S shaped or sigmoid.
(1) The exponential model is specified as follows:

or equivalently:

where: Nij is the expected number of events (that is, transitions from statei at the beginning of the interval to statej at the end of the interval);αij is the log (expected number of events during 1 unit of time at age 0);βij is the log (ratio of the number of events during 1 unit of time at agex and age x+1);X is age;Ri is exposure time for statei andMij is the transition rate from state i to state j. Log(Ri) handles differences in exposure times and is known in statistical literature as the “offset parameter”.
(2) The Gompertz-Makeham model is specified as follows30:

where: Mij is the transition rate from state i to statej,αij andβij are the regression coefficients, X is age, andAij is the constant of Makeham. The Makeham constant reflects that besides the exponential component, there also exists a component that is independent of age
(3) The Sigmoid model is specified as follows:

where: ςij is a constant (sigmoid constant) that can be interpreted as an age independent maximum transition rate.
The likelihood ratio test was used to select between the exponential model and the Gompertz-Makeham and Sigmoid model, respectively. We used a significance level of 0.01 rather than 0.05 to take into account dependency between the observations in the subsequent waves. All models were estimated in GLIM.31 We found that for transitions from the non-disabled and the disabled state to dead, the model with the fewest parameters—the Gompertz—model could be selected to describe the transition rates by age. However, the fit improved significantly by using the Gompertz-Makeham function for incidence for men (p<0.001) and the Sigmoid function for recovery for men and women (p<0.001). Although the improvement in fit by adding the Makeham constant did not completely reach statistical significance for incidence in women (p=0.015), we decided to include the Makeham constant for women as well, to obtain the same models for men and women. Table TA1 presents the parameters of the regression equations for incidence of disability, recovery from disability, mortality among non-disabled and among disabled persons for men and women. The level is expressed by αij, the change with increasing age by βijand M and ς are the Makeham and Sigmoid constant, respectively. Substitution of these parameters in the regression equation gives the transition rates by age.
Parameters of the poisson-regression analysis (SE in parentheses)
INCIDENCE, RECOVERY AND MORTALITY RATES FOR THE NON-SMOKING POPULATION
Given that for each transition, the transition rates in the mixed smoking-non-smoking population are the weighted average of transition rates of smokers and non-smokers, with the proportion of smokers and non-smokers, respectively as weights:

where: Mij is the baseline transition rate from state i to statej; p is the proportion of smokers (smoothed using least square regression of the logit of the proportion on age),Mnsij is the transition rate from state i to state j for non-smokers;Msij is the transition rate from state i to statej for smokers andRRij is the ratio associated of smoking on the transition from state i to state j.
Given that:

the transition rate in nonsmokers can be derived, by combining the previous two equations:

Sex and age indices are suppressed.
References
Footnotes
-
Funding: this study was supported by the Priority Programme on Population Research of the Netherlands Organisation for Scientific Research (NWO).
-
Conflicts of interest: none.