Article Text

Abstract
Objectives: To assess the effects of neighbourhood level socioeconomic status (SES) and convenience store concentration on individual level smoking, after consideration of individual level characteristics.
Design: Individual sociodemographic characteristics and smoking were obtained from five cross sectional surveys (1979–1990). Participants’ addresses were geocoded and linked with census data for measuring neighbourhood SES and with telephone yellow page listings for measuring convenience store concentration (density in a neighbourhood, distance between a participant’s home and the nearest convenience store, and number of convenience stores within a one mile radius of a participant’s home). The data were analysed with multilevel Poisson regression models.
Setting: 82 neighbourhoods in four northern California cities.
Participants: 8121 women and men aged 25–74 from the Stanford heart disease prevention programme.
Main results: Lower neighbourhood SES and higher convenience store concentration, measured by density and distance, were both significantly associated with higher level of individual smoking after taking individual characteristics into account. The association between convenience store density and individual smoking was modified by individual SES and neighbourhood SES.
Conclusions: These findings are consistent with a growing body of literature suggesting that the socioeconomic and physical environments of neighbourhoods are associated with individual level smoking.
- deprivation
- multi-level
- neighbourhood characteristics
- smoking
- socioeconomic factors
Statistics from Altmetric.com
Recent studies suggest that neighbourhood level characteristics have an independent effect on individual level smoking behaviours after consideration of individual level socioeconomic status/position (SES).1–9 The underlining premise of neighbourhood level effects on smoking implies that two otherwise identical people have different probabilities of smoking because they live in different types of neighbourhoods.10,11
Neighbourhood influences are hypothesised to affect individual health behaviours through a variety of mechanisms, including availability of goods and services, community norms and values, and psychological stress associated with living in a disadvantaged neighbourhood.7,12,13 Data that directly measure these neighbourhood characteristics are not easily accessible on a large scale; therefore, prior studies have primarily relied upon census variables to characterise the context of neighbourhoods.14,15 Because individual smoking behaviours may be strongly influenced by the availability of tobacco products, assessing goods and services in a neighbourhood is important for tobacco research. Previous studies suggest that reductions in the physical availability of tobacco products in neighbourhoods are associated with lower levels of smoking.16
To contribute to the evidence on the influence of goods and services on individual health behaviours, we examined whether convenience store (corner shops) concentration influenced individual smoking. We chose convenience stores as a proxy measure for tobacco availability as they account for the largest sales of tobacco of all types of tobacco retail outlets (for example, fuel stations, small grocery stores) and they have more tobacco advertising than other retail outlets.17,18 We hypothesised that three measures of convenience store concentration (density in a neighbourhood, distance between a participant’s household and the nearest convenience store, and number of convenience stores within a one mile radius of a participant’s household) would be associated with individual smoking. In addition, we hypothesised that neighbourhood SES would be associated with individual smoking, after consideration of individual sociodemographic characteristics.
We also hypothesised that the effects of neighbourhood SES on smoking would be mediated by convenience store concentration. We felt that such a pathway might exist as previous studies have showed that retail tobacco outlets are more likely to exist in low SES neighbourhoods than in high SES neighbourhoods. However, a competing hypothesis may also exist. Areas with a high density of tobacco outlets can potentially create undesirable locations where rental costs are low and the lower costs may attract people with low SES, resulting in community norms that favour smoking. We also hypothesised that cross level effects might occur where the effects of convenience store measures and neighbourhood SES would be stronger for low SES people than for high SES people. We felt that this might be evident because low SES people may be more vulnerable to disadvantaged environments as they may be less knowledgeable about the harmful effects of smoking, have fewer resources to stop smoking, and experience more stressors in their daily lives than high SES people.19 We also tested the interactive effects of convenience store concentration and neighbourhood SES on smoking. Specifically, we examined whether the influence of convenience store concentration on smoking depends on neighbourhood SES.
METHODS
Data
The individual level data are from the Stanford heart disease prevention programme, a 15 year community based intervention study in northern California focusing on the prevention of cardiovascular disease.20 Five cross sectional surveys in four cities were conducted between 1979 and 1990. The sample for this study included women and men aged 25–74 participating in one of the five surveys (n = 8419). Neighbourhoods (n = 82) were defined by census tracts, census block groups, or a combination of census tracts and block groups based on consultations with local city planners, examination of archival maps of the cities, and by comparing 1980 and 1990 census tract and block group boundaries. Respondents who were not accurately geocoded to their neighbourhoods based on home addresses (3%), and who did not have detailed smoking data (1%) were excluded, resulting in a final sample size of 8121.
Dependent variable
Individual level smoking was measured from the question, “On average, how many cigarettes a day do you now smoke?” Values ranged from 0 to 80 cigarettes per day.
Individual level variables
Individual level SES was calculated from two indicators: educational attainment and annual household income. Education was measured by asking respondents, “What is the highest year of formal education you have completed?”, which was categorised into four levels: 0–11, 12, 13–15, and over 16 years. Income was measured by asking participants, “How much was your household’s total income for the last year, including income from all sources for all household members living with you?” with responses ranging from “under $5000” to “$100 000 and over” on a 12 point scale. Poverty status was created by dividing the midpoint of each income category by the federal poverty threshold according to year and household size, which was categorised into four levels: 0%–200%, 201%–400%, 401%–600%, and greater than 600%. A composite SES score was created by averaging levels of education and poverty status for each respondent. A higher score represents a person with a higher SES. Sex, age (continuous), and self reported race/ethnicity (Hispanic, white non-Hispanic, other ethnicity) were included in the analysis as control variables.
Neighbourhood level variables
Neighbourhood SES was derived from 1980 and 1990 census data. The 1980 and 1990 census data were matched to the first and fifth survey data respectively; linear interpolation was used for the three middle survey values. To characterise neighbourhood level SES, five variables were selected: percentage less than high school education, percentage blue collar workers, percentage unemployed, median annual family income, and median housing value, based on the result of a principal component analysis. Each variable was standardised separately by city and survey. A neighbourhood SES score was created by summing the five variables according to survey year. A higher score represents a higher neighbourhood SES. Scores were divided into tertiles based on the distribution in each survey year.
Addresses of convenience stores were collected from the business listing of telephone books for the survey years (1979–1990). About 98% of the stores were successfully geocoded to the defined neighbourhoods. Three convenience store measures were assessed: density, distance, and number of stores within a one mile radius. The last two measures were calculated using geographical information systems software. To measure density, the number of stores per square mile in a neighbourhood was calculated according to survey year. Because of the skewed distribution, the scores were divided into tertiles based on the distribution in each survey year. Each neighbourhood had on average about two convenience stores (range 0 to 14). The measure of distance was obtained by calculating the straight line distance between a participant’s home and the nearest convenience store. Values ranged from 0.003 to 4.173 miles. To measure the number of convenience stores within a one mile radius, a circular buffer zone was created around each participant’s home and the number of stores was counted within the buffer zone. The radius of one mile was selected as it represents an area around the household where people might be most likely to use goods and services. The number of convenience stores in the buffer zones ranged from 0 to 9. Because of the skewed distribution, the numbers were divided into tertiles based on the distribution in each survey year. The lowest tertile represented about none to two stores, the middle tertile three to five stores, and the highest tertile six or more stores.
Analysis
We used multilevel models to analyse our data. Multilevel models are generally used to simultaneously examine the effects of group level and individual level variables on individual level outcomes. We used the SAS macro Glimmix to fit multilevel models (individuals at level 1 nested within neighbourhoods at level 2) with a Poisson distribution assumption and a log link.21 The method of estimation was a restricted maximum likelihood procedure. According to a recent review of software programs (MLwiN, SAS Glimmix macro, HLM, and VARCL) for generalised linear multilevel models, all programs produce similar estimates for fixed and random effects at levels two and three.22 Models were first fitted including each main effect of neighbourhood level characteristics, including neighbourhood SES and convenience store measures. Models then added individual level characteristics to assess whether each neighbourhood level effect was explained by individual characteristics. Then, neighbourhood SES and convenience store measures were both included in a same model to assess whether convenience store concentration mediated the effects of neighbourhood SES or whether neighbourhood SES mediated the effects of convenience store concentration. Next, two way interaction terms of individual level SES and neighbourhood level characteristics were added to the model to test whether the effects of neighbourhood level characteristics on smoking were modified by individual level SES. Lastly, two way interaction terms between convenience store measures and neighbourhood SES were included in the model to test whether the effects of convenience store concentration on smoking were modified by neighbourhood SES.
RESULTS
Table 1 presents descriptive statistics for key variables. Most of the sample was white, non-Hispanic (83.2%). Over one half of the sample had completed at least some college and over 40% had incomes over 400% of the federal poverty level. Because we stratified neighbourhood SES and the convenience store measures into tertiles based on the distribution in each survey, each strata accounted for about one third of the sample.
Individual level characteristics, neighbourhood SES, convenience store concentration, and number of cigarettes smoked per day, Stanford heart disease prevention programme (1979–1990) (n = 8121)
Men, middle aged adults, white people, and people with lower educational attainment and lower incomes reported a higher number of cigarettes smoked per day than their counterparts. Furthermore, people living in neighbourhoods with a higher proportion of low SES residents and a higher concentration of convenience stores smoked more cigarettes per day. We also examined level of smoking in different neighbourhood strata using a categorical smoking outcome. People were divided into non-smokers, light smokers, and heavy smokers (0, 1–9, and more than 10 cigarettes per day). This analysis showed that a higher percentage of people in low SES neighbourhoods or neighbourhoods with high convenience store density were heavy smokers compared with their counterparts living in high SES neighbourhoods or neighbourhoods with low convenience store density (data not shown).
Table 2 shows bivariate relations between neighbourhood SES and each convenience store measure. A significantly higher level of convenience store concentration was found in low SES neighbourhoods, whether measured by density of stores, percentage of respondents living either near a store, or percentage having a high number of stores within a one mile radius of their home.
Bivariate relation examining convenience store distribution by neighbourhood SES
Multilevel modelling results are shown in table 3. Model 1 was comprised of a set of random intercept models in which each neighbourhood level and individual level characteristic was regressed on smoking in separate models. As expected, men smoked more than women (b = 0.247), Hispanics smoked less than non-Hispanics (b = −0.744), and higher SES people smoked less than lower SES people (b = −0.174). People who lived in higher compared with lower SES neighbourhoods smoked less (b = −0.304) whereas those who lived in neighbourhoods with high compared with low convenience store density smoked more (b = 0.165) The other two measures of convenience store concentration, distance and counts within a one mile radius of respondents’ homes, also showed significant effect sizes, with people living close to a store (b = −0.182) or having more stores within a one mile radius of their homes smoking more than people from their respective reference groups (b = 0.131, middle/low).
Associations between individual characteristics, neighbourhood SES, convenience store concentration, and number of cigarettes smoked per day, Stanford heart disease prevention programme (1979–1990) (n = 8121)
Models 2 to 5 are random slope models in which the coefficient for individual SES was allowed to vary by neighbourhood. Model 2 and 3 evaluates whether neighbourhood SES and convenience store density were associated with individual smoking above and beyond individual level characteristics. After controlling for individual level characteristics, neighbourhood SES remained negatively associated with people smoking (model 2, b = −0.280) and high convenience store density remained positively associated with individual smoking (model 3A, b = 0.174). When convenience store concentration was measured by distance and counts within a one mile radius, the significant effect remained for distance (model 3B, b = −0.154) but not for counts within a one mile radius.
Model 4A shows that convenience store density was not associated with smoking when neighbourhood SES was added to the model, suggesting that neighbourhood SES may mediate or confound the relation between convenience store density and smoking, rather than the reverse. A similar pattern of results was found for the other two convenience store measures. Distance and the counts within a one mile radius were not associated with smoking after including both individual characteristics and neighbourhood SES (model 4B and 4C).
To find out if there was an interactive effect between individual SES and neighbourhood level characteristics, we included interaction terms in model 5A, 5B, and 5C. Results in model 5A, 5B, and 5C suggest that individual SES significantly interacted with both neighbourhood SES and each high convenience store measure. Model 5A also shows an interaction between convenience store density and neighbourhood SES. While no significant interactive effects were found between individual SES and the other two convenience store measures, significant interactive effects between neighbourhood SES and distance, as well as neighbourhood SES and counts within a one mile radius were found in model 5B and 5C.
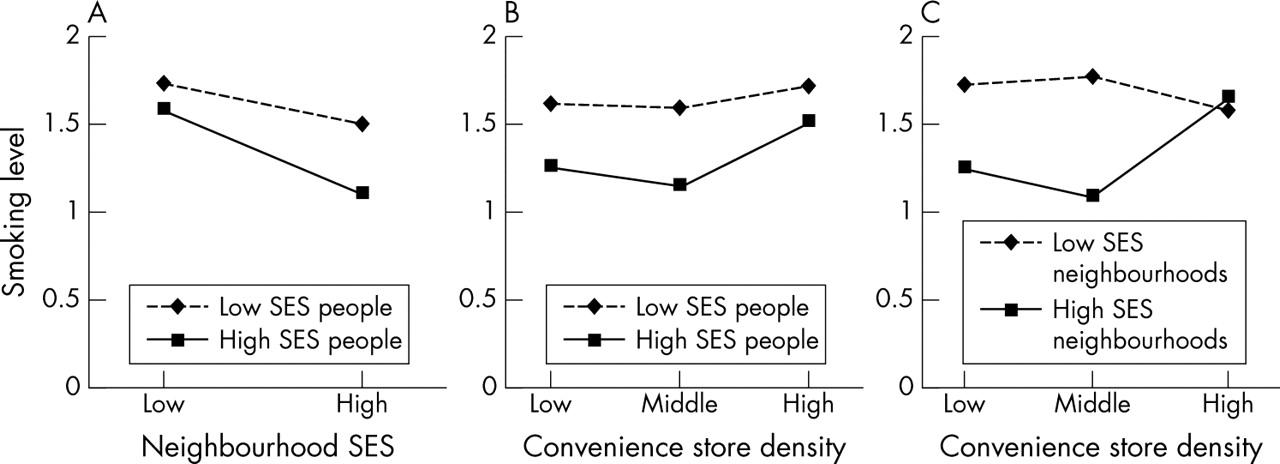
Figure 1A presents the relation between neighbourhood SES and level of smoking by individual level SES, using a median split. In high SES neighbourhoods, high SES people had a lower level of smoking than low SES people; however, in low SES neighbourhoods, the two groups had a similar level of smoking. The slopes show that the association between neighbourhood SES and individual smoking was stronger for high SES people than for low SES people.
Interactive effects among individual SES, neighbourhood SES, and convenient store density on level of smoking*. (A) Effects of neighbourhood SES on level of smoking by individual SES. (B) Effects of convenience store density on level of smoking by individual SES. (C) Effects of convenient store density on level of smoking by neighbourhood SES. *Mean number of cigarettes smoked per day generated from multilevel models with a Poisson distribution assumption and a log link.
Figure 1B presents the relation between convenience store density and level of smoking by individual level SES. While high SES people had a lower level of smoking than low SES people in neighbourhoods with low and middle convenience store density, high SES people had a similar level of smoking as low SES people in neighbourhoods with high convenience store density.
Figure 1C shows the relation between convenience store density and level of smoking by neighbourhood level SES, using a median split. People living in high SES neighbourhoods had a higher level of smoking when their neighbourhoods also had a high density of convenience stores compared with their counterparts living in neighbourhoods with middle or low density of convenience stores. In contrast, for people living in low SES neighbourhoods, smoking levels were high regardless of the density of convenience stores. A similar pattern was found when convenience store concentration was measured by distance and counts within a one mile radius, suggesting that the effects of convenience store concentration were influential only when participants lived in high SES neighbourhoods (not shown).
Policy implications
The findings of this study point to potential public health and policy interventions. Such interventions could include restricting tobacco advertising and promotions within and around convenience stores, restricting pro-tobacco incentives to store owners/managers from the tobacco industry; limiting the physical access of tobacco products (for example, locked cabinets to which store personnel only have access); requiring the prominent display of health warning messages; enforcing underage laws; and increasing the costs of tobacco sold in convenient stores. To reduce smoking, public health policy should be developed and modified according to the neighbourhood environment.
DISCUSSION
Our findings are consistent with prior studies that have assessed associations between neighbourhood SES and individual smoking among adults.1–9 We found that higher neighbourhood SES was associated with lower levels of smoking, after consideration of individual level characteristics. To assess the influences of convenience store concentration on individual level smoking, we used three measures: density in a neighbourhood, distance between a participant’s home and the nearest convenience store, and number of convenience stores within a one mile radius of a participant’s home. We found that convenience store density and distance were associated with individual smoking, after consideration of individual level characteristics. In contrast with density and distance, number of stores within a one mile radius was not associated with individual smoking.
The results on cross level interactions suggest that neighbourhood effects may operate through different mechanisms for people with high and low SES. We found that for high SES people, the protective effects of individual SES may be reduced if they live in low SES neighbourhoods or in neighbourhoods with high convenience store concentration. We also found that the effects of convenience store density exist in high SES neighbourhoods, but not in low SES neighbourhoods. One possible explanation is that people living in low SES neighbourhoods may have greater access to tobacco products (for example, more liquor stores) and more pro-tobacco influences (for example, neighbours who smoke) than people living in high SES neighbourhoods. Therefore, convenience store concentration may not be a sufficient indicator of tobacco availability in low SES neighbourhoods.
The main contribution of our study is the use of three different measures of convenience store concentration to examine tobacco availability in neighbourhoods. We believe that each measure represents different conceptual dimensions of convenience store concentration. While density is more likely to reflect the effects that consider natural boundaries, as census tracts were created by visible boundaries (highways, streets), distance and counts measures are more likely to reflect the immediate convenience store effects surrounding each participant’s home.
Our findings should be considered in light of the following limitations. Firstly, we did not have longitudinal neighbourhood measurements, which may generate selection bias. The relation between neighbourhood characteristics and smoking may be attributable to the non-random selection of people into neighbourhoods and not because of neighbourhood influences.23 Therefore, these relations should be interpreted as associations only.
Secondly, we did not measure the length of time that participants had spent in their neighbourhoods and the extent of their exposure to the neighbourhood environment. We were thus unable to determine whether changes in smoking behaviours were attributable to cumulated neighbourhood effects.23
What this paper adds
Firstly, in the field of neighbourhood influences on health, we know of no other study that has assessed the potential mediating and/or moderating influence of tobacco outlets on the pathway between neighbourhood SES and smoking using a population based and a multilevel study design. In this paper, we assessed the influence of tobacco outlets on individual level smoking using three different measures of convenience store concentration in residential areas using a geographical information system (density in a neighbourhood, distance between a participant’s home and the nearest convenience store, and number of convenience stores within a one mile radius of a participant’s home). Secondly, unlike previous studies, which defined neighbourhood boundaries by census tracts, we carefully assessed neighbourhood boundaries by consultations with local city planners, examination of archival maps of the cities, and comparison with 1980 and 1990 census tract and block group boundaries.
Thirdly, we did not measure the total availability of all tobacco in a neighbourhood. Of the licensed outlets, we did not include drug stores, supermarkets, tobacco shops, and liquor stores.17,18 We believe this coverage error may be limited because convenience stores account for the largest sale of tobacco from all retail tobacco outlets.17,18 In addition, because tobacco companies have targeted convenience stores as an important market arena for tobacco advertising in recent years, the influence of convenience stores is increasing.24 A final limitation is that convenience stores were collected by using telephone book yellow page listings. Therefore unofficial businesses would not have been counted, which may generate another type of coverage error.
These limitations aside, the findings of this study point to potential public health and policy interventions. Such interventions could include restricting tobacco advertising and promotions within and around convenience stores, restricting pro-tobacco incentives to store owners/managers from the tobacco industry; limiting the physical access of tobacco products (for example, locked cabinets to which store personnel only have access); requiring the prominent display of health warning messages; enforcing underage laws; and increasing the costs of tobacco sold in convenient stores.
Acknowledgments
The authors thank Naomi Kawakami for her GIS expertise, Alana Koehler for manuscript preparation and formatting of the figures, and David Rogosa for statistical consultation.
REFERENCES
Footnotes
-
Funding: this work was co-funded by the National Institute of Environmental Health Sciences and the National Heart, Lung, and Blood Institute, USA: grant RO1 HL67731 to Dr Winkleby.
-
Conflicts of interest: none declared.
-
Ethics approval: all research was approved by the ethics committee at Stanford University, School of Medicine and conforms to the principles of the Declaration of Helsinki.