Article Text

Abstract
Objective: Recent studies suggest an association between the contextual attributes of neighbourhoods and the health status of residents. However, there has been a scarcity of studies that have directly measured the material characteristics of neighbourhoods theorised to have an impact on health and health inequalities. This paper describes the development of an innovative methodology to measure geographical access to a range of community resources that have been empirically linked to health. Geographical information systems (GIS) were applied to develop precise measures of community resource accessibility for small areas at a national scale.
Design: Locational access to shopping, education, recreation, and health facilities was established for all 38 350 census meshblocks across New Zealand. Using GIS, distance measures were calculated from the population weighted centroid of each meshblock to 16 specific types of facilities theorised as potentially health related. From these data, indices of community resource accessibility for all New Zealand neighbourhoods were constructed.
Results: Clear regional variations in geographical accessibility to community resources exist across the country, particularly between urban and rural areas of New Zealand. For example, the average travel time to the nearest food shop ranged from less than one minute to more than 244 minutes. Noticeable differences were also apparent between neighbourhoods within urban areas.
Conclusions: Recent advances in GIS and computing capacity have made it feasible to directly measure access to health related community resources at the neighbourhood level. The construction of access indices for specific community resources will enable health researchers to examine with greater precision, variations in the material characteristics of neighbourhoods and the pathways through which neighbourhoods impact on specific health outcomes.
- neighbourhoods
- community resources
- accessibility
- geographical information systems (GIS)
Statistics from Altmetric.com
A number of recent studies have noted the importance of place or neighbourhood effects in explaining geographical and social variations in health.1–3 The focus of such work has been to consider whether particular attributes of the places in which people live have an effect upon their health, independently of a person’s sociodemographic characteristics. Although the effect is generally small relative to individual factors most studies have found contextual factors are significant in explaining variations in health outcomes and health related behaviour.4,5 A renewed focus on place as a key theoretical and policy relevant determinant of health has ensued, and intervention at the area level has become an important part of strategies to reduce health inequalities.6,7 A striking feature of the research field is the diversity of neighbourhood contextual factors that have been investigated,5,8 including the influences of social capital,9,10 social inequality,11 area deprivation,12 residential segregation,13 and sense of neighbourhood,14 as well as environmental influences such as air pollution15 or radon gas.16
One important set of contributions to these debates has been research into the influence of accessibility to community resources such as parks and recreational facilities, healthcare facilities, and public transport. Residential proximity to facilities and services can be theorised as contributing to health and wellbeing in a number of ways. In addition to easier and more direct access to places to shop, exercise, work, meet neighbours, have a health check, etc, it confers opportunities by reducing the time and financial costs of access, which in turn frees individual and household resources for use elsewhere. It also offers lifestyle choices.17 Previous work has noted distinct geographical and social variations in the access to many different aspects of the spatial infrastructure of local neighbourhoods, including educational resources, health facilities, recreational amenities, access to healthy food provision, and public transport options.18,19 For example, poor access to retail provision of healthy and affordable food has become imbedded within the recent debates in the UK surrounding social exclusion and health inequalities with various policy initiatives addressing the issue of so called “food deserts” in some, often socially deprived, neighbourhoods,20,21 which it has been argued has a detrimental effect upon health.22 Other researchers have focused on alternative aspects of the local infrastructure such as the availability of amenities,23 aspects of the built urban environment,24 and appropriately designed open space.25 Similarly, there has been much work on geographical accessibility to healthcare resources in local communities such as access to GP surgeries in rural communities.26 These results are supported by the extensive work on urban localities in Glasgow by Ellaway, Macintyre, and colleagues who found that opportunity structures, such as recreational facilities, public transport, and health food supplies, can differ between more and less deprived neighbourhoods.27–29
Studies that have focused on geographical access to community resources within local communities30,31 have often been limited by the arbitrary nature in which neighbourhoods have been “conceptualised and operationalised”.27 In many instances neighbourhood has been predefined as the administrative unit (often census areas) for which data are easily available.32 By adopting definitions of neighbourhood that are more closely specified by the causal models under investigation, it becomes possible to explore how different aspects of neighbourhoods affect different population groups at different times.8,27 Furthermore, because of the difficulties of data collection, most previous studies have been limited in their scope in terms of considering a confined geographical area such as a city, rather than examining the effects of access to community resources at a national level.32 The adoption of geographical information systems (GIS) methods into neighbourhood and health research offers new opportunities to incorporate particular features of neighbourhoods and to directly measure access to community resources within those neighbourhoods. Recently, researchers have noted the potential for using a GIS framework for defining socially heterogeneous neighbourhoods for use in health analysis,33 as well as for measuring distance to particular facilities such as the nearest convenience store.34
This paper provides a novel methodology for calculating geographical accessibility to 16 types of health related community resources at a national level across both urban and rural areas. The adoption of a GIS framework permits the integration of data that have been collected in different ways by discrete institutions to directly measure features of the social and physical environment of the neighbourhood in which people live. By incorporating community resource data, which is precisely located in space, into a GIS it becomes possible to conceptualise community resource access at varying spatial scales in the local and surrounding communities and to derive small area estimates of accessibility. It is our intention to develop an approach that will assist in furthering the theoretical understanding of how neighbourhoods influence health and health inequalities. The development of the index forms the first stage of a wider research programme that seeks to examine the influence of New Zealand neighbourhoods on a range of health outcomes. The index will be used to make comparisons between the opportunity structures in local neighbourhoods and the health and wellbeing of residents. In particular, we will consider whether poor neighbourhoods in New Zealand with poor health suffer from the “double jeopardy”35 of a local infrastructure that is insufficient to lead to a healthier life. We envisage that the index will also be of interest to those with an interest in locality based policy and planning.
METHODS
Neighbourhood accessibility was calculated for five selected domains where a biologically plausible mechanism can be identified for one or more health outcomes such as mortality, heart disease, and diabetes. The index does not suppose to incorporate all components of neighbourhood context that may influence health, but rather, based upon a survey of the literature, identifies key local community resources27 that are particularly important in a New Zealand context. None the less, the methods adopted below are designed to be transferable to alternative community resources in other contexts. The domains included within the index were recreational amenities, shopping facilities, educational facilities, health facilities. and marae (a Maori meeting place). In each domain, with the exception of the marae domain, locational access to a set of sub-domains was calculated (table 1). An index of accessibility was computed for each of the sub-domains and was used to calculate an aggregate measure for each of the broader domains.
Summary of data collected to calculate community resource accessibility for small areas across New Zealand
Data sources
For each sub-domain, the precise location of all relevant facilities in New Zealand was obtained. The sources of the data varied for each sub-domain, but where possible nationally collected datasets were used to maintain a consistent and directly comparable dataset.32 Some of the datasets (for example, hospitals) were readily available in a GIS format at the national level and could be directly incorporated into the analysis. For other datasets (for example, food outlets), the data had to be requested from the 74 individual territorial local authorities (TLAs: local authorities with some delegated governance) across the country and then the precise location of each record computed from its address using the geocoding software in ESRI ArcMap 9.0 GIS software. For the datasets that had to be geocoded a small number of locations were not recognised by the geocoding software ranging from 0.1% for the food establishment sub-domain to 3.5% for the sports and leisure sub-domain. The location of each resource was represented as a precise point in space except for those resources with a large surface area (for example, a large park), which were represented as multiple points 100 metres apart from each other. To provide temporal consistency, most of the data collected were accurate at time of collection (2004–2005) and no dataset was older than 2002. Details of the sources of the data used to calculate each sub-domain are provided in table 1.
GIS methodology
Community resource accessibility was calculated for each sub-domain for all 38 350 census meshblocks across New Zealand. Meshblocks are the smallest unit of dissemination of census data in New Zealand, with each area representing about 100 people. In this analysis, each meshblock was represented by its population weighted centroid (the centre of population in the area rather than the geometric centroid) and the travel time taken to each community resource (for example, a hospital) along the road network was calculated using the network functionality in ArcInfo GIS. Population weighted centroids were used because in large rural meshblocks the geometric centroid is often positioned at a significant distance from the centre of population and hence from the road network. Meshblocks in New Zealand vary in area from less than 1 km2 in some meshblocks in the centre of the major urban areas to 2197 km2 for a meshblock in the rural south west of the country. As noted in our previous research, to represent accessibility more accurately, it is important to use the distance between each meshblock and the location of each community resource through the road network to calculate total travel time rather than the straight line distance.36 All segments in the road system were adjusted to account for variations in speed limits, type of road surface, sinuosity, and differences in the topography across the network. The origin to destination matrix was imported into a relational database for analysis so that the closest facility to each meshblock could be identified. For sub-domains where facilities occupy a large land area (for example, parks and beaches) the intersection of the road network with the outer boundary was considered an access point. For other domains, a single point was used to record the location of the destination (facility).
Access indices
In all 38 350 meshblocks the travel time along the road network between each population weighted meshblock centroid and its closest facility (for example, the travel time to the nearest school) was calculated for the 15 sub-domains (and the marae domain). Sub-domain values were aggregated to form domain level indices for each meshblock. The 38 350 meshblocks were then assigned to quintiles according to their level of access, for each domain and sub-domain. The fifth of meshblocks with the least travel distance to a particular community resource were allocated to quintile 1 (highest access) and, similarly, the fifth of the meshblocks with lowest level of access (longest travel times) were allocated to quintile 5 (lowest access). The calculated meshblock scores for each sub-domain provide a relative measure of the extent to which the meshblock is community resource rich or community resource poor, compared with all of the other meshblocks in New Zealand.
RESULTS
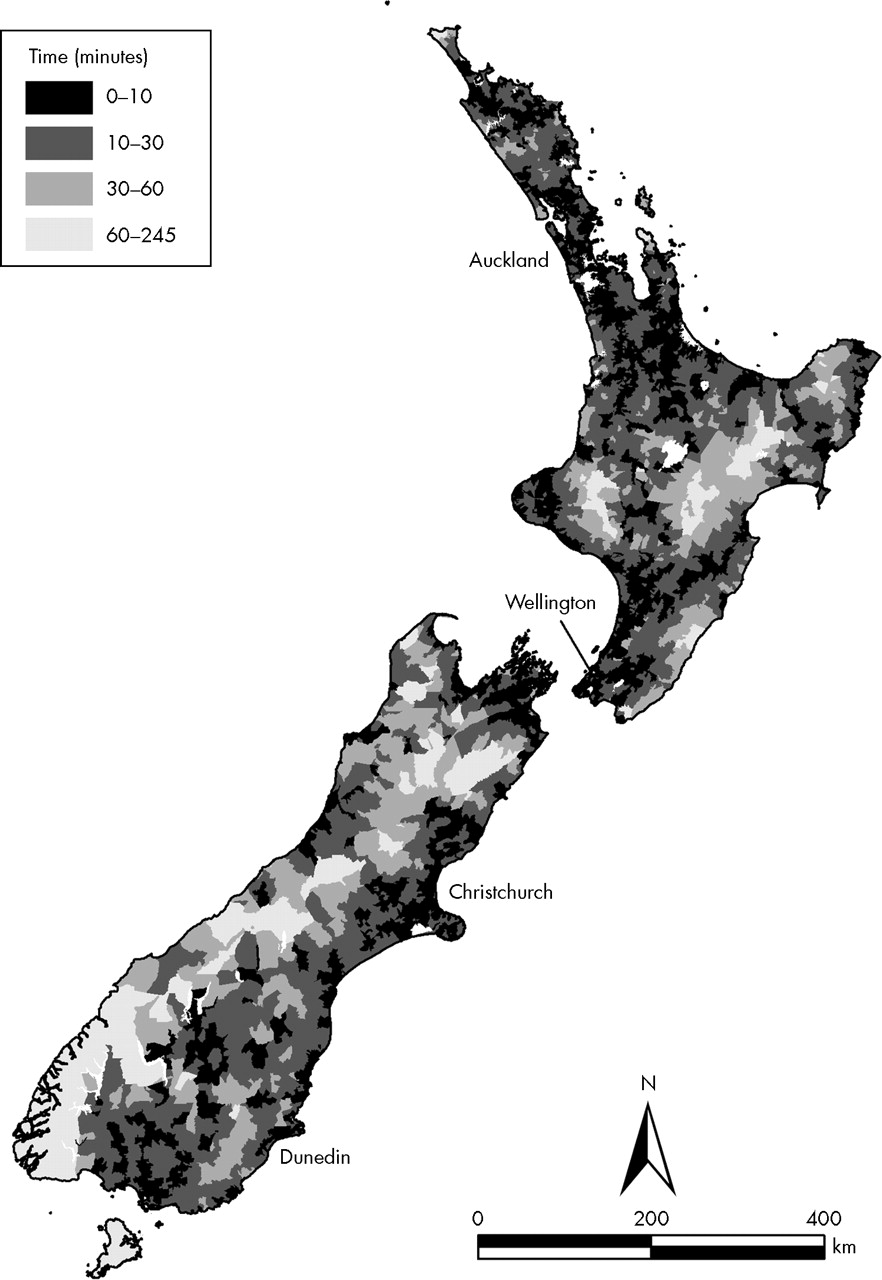
Access to community resources in New Zealand varied by domain and sub-domain (table 2). For the whole of New Zealand, the least accessible community resource sub-domain was beaches (mean travel time 23.22 minutes) while the most accessible sub-domain was parks (mean travel time 2.83 minutes). There are also clear regional variations in geographical accessibility to community resources across the country as well as pronounced differences between neighbourhoods within urban areas. Figure 1 provides an example of the time travelled to fresh food establishments (including grocery shops, fruit and vegetable vendors, dairies, and petrol stations selling food) for all meshblocks across New Zealand. As expected there is a strong urban-rural gradient in geographical access to fresh food shops with greater levels of accessibility in the major urban centres and lower levels of accessibility in the rural areas such as the Fiordland region in the south west of the South Island. The mean travel time from each meshblock centroid to the closest food shop was 5.17 minutes but the distances ranged from less than one minute for some meshblocks in urban centres to more than 244 minutes in one extremely isolated rural meshblock (table 2). The higher level of accessibility in urban areas was evident for most of the sub-domains except for access to outdoor recreational activity where access was greatest in rural areas, and to beaches that were more accessible around the coastline and some inland lakes. As noted above, for each sub-domain, the travel time measurements were used to divide all meshblocks in New Zealand into quintiles of accessibility.
Summary statistics and lowest value in each quintile for travel time (in minutes) to domains and sub-domains of community resources for all meshblocks across New Zealand

Total travel time to closest food establishment for all meshblocks across New Zealand.
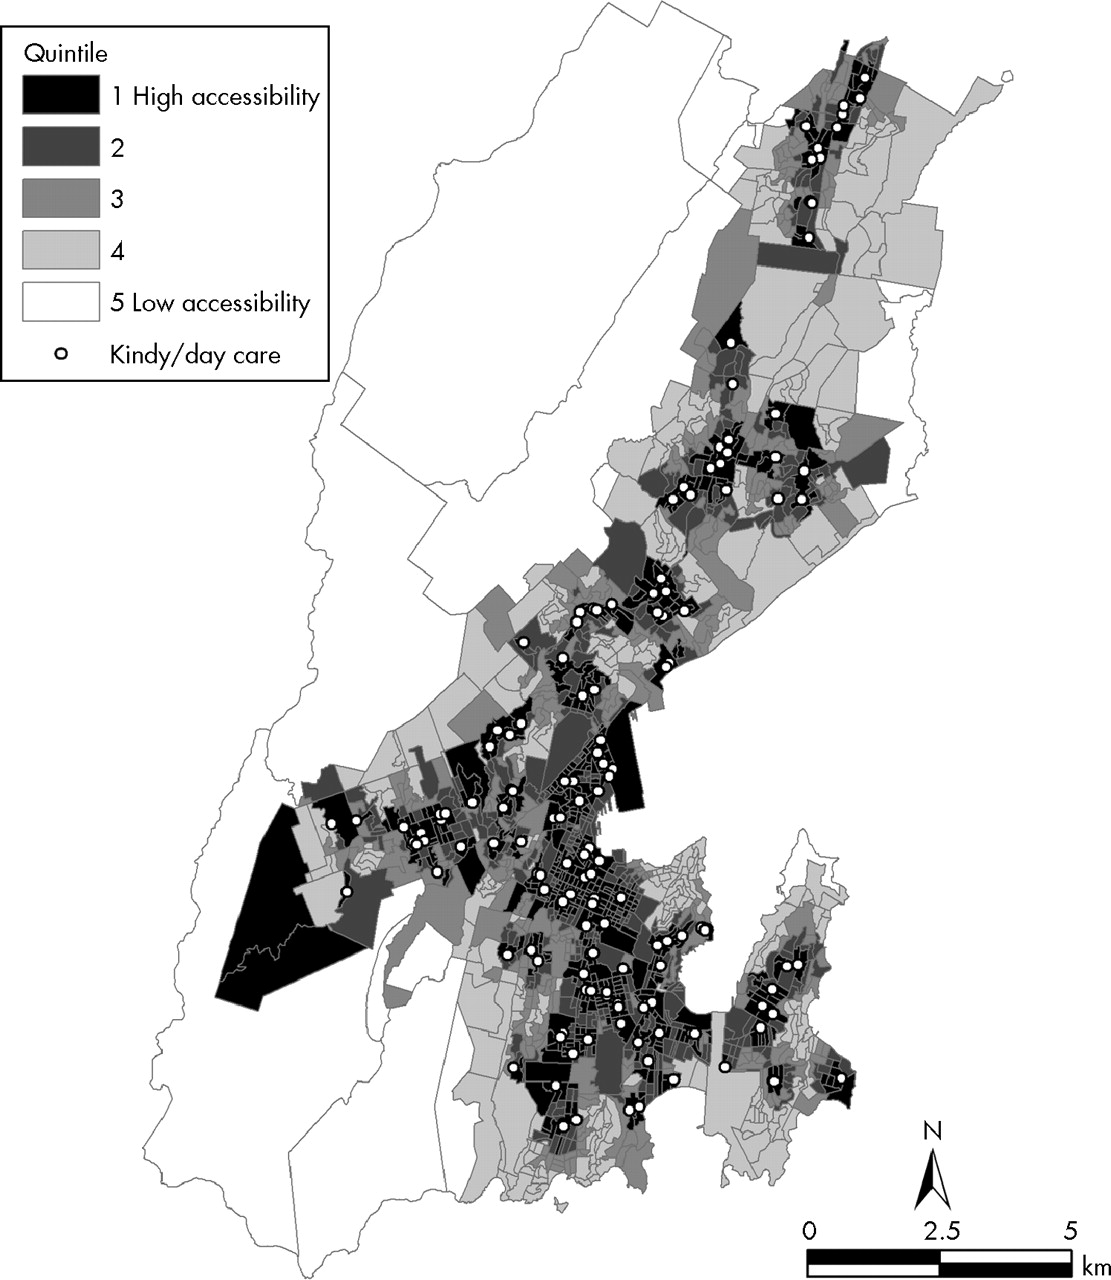
There are also strong geographical variations in community resource accessibility between neighbourhoods within an urban area. For example, in Christchurch (the major urban centre on the South Island) there is greater access to food establishments in most central areas of the city and along major arterial routes (fig 2). It is interesting to note that there is variation evident between residential areas within cities and that there are pockets of locational disadvantage with, for example, accessibility to food establishments in Christchurch meshblocks ranging from less than a minute in the central city to over 20 minutes in the semi-rural periphery. Similar intra-urban trends are noted for other sub-domains such as access to daycare centres in the city of Wellington (fig 3). Again it can be noted that there is greater accessibility in the central areas of Wellington and along major arterial roads, but in meshblocks on the outer fringes of the city access to daycare centres is among the lowest in New Zealand.

Travel time from population weighted meshblock centroids to closest food establishment in Christchurch.
Travel time from population weighted meshblock centroids to closest daycare centre in Wellington.
DISCUSSION
Conceptualising context in many studies of the neighbourhood determinants of health has been limited because of the use of readily available global measures such as indices of deprivation derived from the census or other social surveys. While these studies have played an important part in determining whether there are important contextual influences upon health, they have been less successful in identifying the specific features of the social, material, and physical environment that influence health. Greater specificity is needed to underpin place based policy initiatives. The unique contribution of the community resource access index as a health focused index of community resource accessibility, is its national coverage and the direct measurement of access using data collected from routine and non-routine sources. Furthermore, the methodology used in constructing the indices permits the data to be readily aggregated for the effects of context to be examined at a range of geographical scales by either calculating the mean travel time for each domain/sub-domain of all meshblocks in the larger area or by using its population weighted centroid (which exist for larger areas such as census area units) and re-running the GIS model. The model has been based on travel times by car but it has the flexibility to be used to calculate walking or cycling times to facilities in urban neighbourhoods. Developing the index has shown that a GIS methodology offers the opportunity to accurately measure accessibility to community resources and, ultimately, to further our understanding of how equity of access to local opportunity structures at different spatial scales affects health.
The selection of neighbourhood resources for inclusion in the index was theoretically driven. Parks, sports and leisure facilities, and beaches provide opportunities for physical exercise, the lack of which is a significant risk factor for the health outcomes of interest in the wider study (for example. cardiovascular disease and diabetes). Likewise, access to supplies of fruit and vegetables is a necessary prerequisite to healthy eating. Educational facilities were included because of the consistent predictive relation between educational outcomes and health and health inequalities.37,38 Furthermore, in rural and urban New Zealand, schools and preschools are significant sites of neighbourhood interaction and community building,38a neighbourhood factors that have been empirically linked to health outcomes.39 For Maori, marae are the heart of family and communal life and are also often sites for the delivery of educational and health services.
What this paper adds
A GIS based methodology has been developed to directly measure travel time access to 16 types of health related community resources across 38 350 small area units in New Zealand. The application has the flexibility to measure and map access to community resources at varying spatial scales and for different travel modes.
Policy implications
The methodology can be used to:
-
Investigate the association between area level deprivation and community resource access;
-
Identify localities that are multiply disadvantaged in terms of community resource provision making it a valuable tool for intersectoral service and amenity planning;
-
Identify the relations between access to specific types of community resources and health outcomes to inform locality based health promotion strategies.
The results show that there are strong geographical variations in accessibility to community resources across New Zealand and that for each sub-domain there are different geographies. Not surprisingly, clear differences are apparent between urban and rural areas with journey times to facilities generally longer in rural neighbourhoods. The methodology used in the construction of the index will enable specific rural and urban relative travel distance indices to be calculated if determinants of health outcomes are modelled independently in urban and rural areas.
New Zealand is a nation of car drivers. It has one of the highest rates of car ownership in the world.40,41 While this may increase community resource access for households with a private vehicle it effectively diminishes access for people in the 10% of New Zealand households without a car,42 as a common consequence of increasing car ownership rates is increasing distances to services and facilities.43 In New Zealand, public transport is poor in many urban areas and non-existent in most rural communities. Consequently, differential access to a car has potential impacts on amenity and services access and on opportunities for social interaction, all factors that may contribute to social inequalities in health. Households without access to a car living in localities with poor access to services face a “double jeopardy” situation.
One of the limitations of the community resource access index is the lack of a public transport domain. The research team identified public transport as a domain for inclusion but unfortunately adequate data on the location of stops and the frequency of public transport services were not available nationwide. Similarly, we were unable to compile a comprehensive national database on all forms of recreation and leisure centres. There are other limitations to the index. The data collection does not have 100% accordance, as although extensive efforts were made to obtain all data for each sub-domain, for some records insufficient information was provided on the address of the resource, meaning that geocoding was impossible. Furthermore, the index is a measure of relative geographical accessibility and does not claim to measure other important types of accessibility such as cultural accessibility or the quality of the resources. Therefore, for example, a community may have good geographical access to recreational activities but a resource in an area considered unsafe by residents is less likely to be associated with positive health outcomes compared with an attractive amenity in a “safe” location.44
In the next phase of our research, the community resource index will be used to examine whether different facets of local neighbourhoods have an independent effect upon a range of health outcomes. We anticipate that the index will be a valuable tool in redressing the lack of systematic work examining which aspects of an area of residence influence which facets of health45 by providing more closely specified causal models, which will allow a priori theoretical models to be tested rather than using off the shelf but conveniently available data. Ultimately we anticipate that the index will help to elucidate what has been described as the “black box of place”.27
Acknowledgments
The authors thank Ionara Wilson and Julia Mitchell for their help with preparing the datasets for analysis. We would also like to thank Matthew Faulk and Laura Miller for their assistance with collecting and geocoding the community resource data and Irfon Jones for creating the maps. Thanks to Tony Blakely and Rosemary Hiscock for comments on an earlier draft of this paper.
REFERENCES
Footnotes
-
Funding: this research was funded by the New Zealand Health Research Council, as part of the Neighbourhoods and Health project within the Health Inequalities Research Programme.
-
Competing interests: none.
Linked Articles
- In this issue