Article Text

Statistics from Altmetric.com
Cigarette smoking is the leading public health problem in the USA, contributing to over 400 000 deaths a year.1 Given its importance, the tobacco control community should be aware of all significant patterns in the consumption of cigarettes that may be relevant to efforts aimed at tobacco control. Unfortunately, little attention has been paid to the seasonal nature of smoking. Findings on seasonal patterns may have major implications for the timing of interventions designed to manage the tobacco problem, both in the USA and in other countries.
In this letter, monthly data for cigarette sales at the state level for the USA are analysed to test for the presence of seasonality and to characterise the phenomenon. The results reveal a seasonal pattern that is significant both in the statistical sense and in magnitude. This includes a significant drop in the winter months of January and February, and an increase during the summer months of June, July, and August.* Because seasonality in sales does not reflect seasonality in production,† it must be inferred that the seasonality is driven by wholesale and retail phenomena, including consumption.
The data used in this study are monthly figures for sales of cigarettes by wholesalers to retailers aggregated at the state level between January 1983 and July 2000. Until December 1997, the Tobacco Institute was responsible for their collection.2 For the period following this, the firm Orzechowski and Walker produced the data.3
Two methods were used to examine seasonality. The first was spectral analysis, which identifies cyclical patterns in the data. If a cycle of a particular length is revealed to be important, then a systematic phenomenon may be inferred to underlie the pattern.4 In the case of seasonality, a cycle of period 12 months would stand out, and the spectrogram of the data would be statistically different from that produced by a white noise or uniform random process (Bartlett’s test). The state level data contain a prominent 12 month cycle, indicating seasonality. In addition, for 46 out of the 51 locations studied, the spectrogram was significantly (5% level) different from that produced by a uniform random process (table 1, column 2).
Second, the time series were seasonally decomposed. This involved splitting the series into trend, seasonal, and irregular components.4 Using the seasonality analysis, a number of indicators were generated. The p values in table 1, column 3 correspond to the null hypotheses of no stable seasonality in sales. At a significance level of 5%, the null hypothesis of no seasonality is rejected for all the states.
In percentage terms, the seasonal effect is large—as column 4 shows, the mean annual range (difference between high and low factors) across the 17 years is about 30%. To put this in perspective, assuming a price elasticity of –0.4,5 a 30% drop in sales would require a 75% increase in cigarette prices!
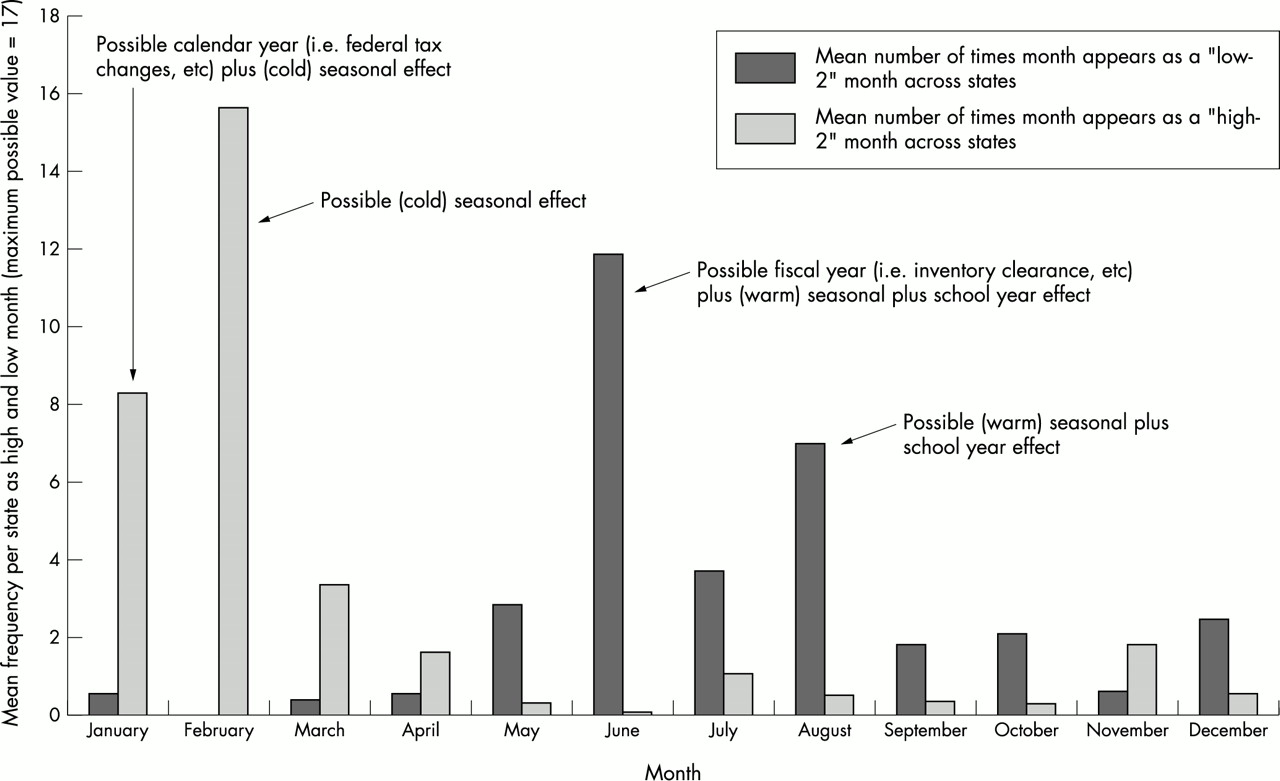
Next, to identify the months for which sales were uniformly high or low for any state, for any one year cycle in the data, the two months with the highest and the two with the lowest seasonal components were selected, and the frequency of the appearance of the months in the “high-2” and “low-2” months was computed by state. Columns 5–8 show the most frequently appearing high and low months. February appears as a “low-2” month for all but one state, and June appears as a “high-2” month for 42 states. Figure 1 shows that January and February are a “low” season for sales, and June, July, and August, a “high” season.
Possible causes of seasonality include the effect of climate on smoking behaviour (low in cold weather and high in mild weather, especially in view of now widespread indoor smoking restrictions across the USA), the timing of tax changes (December-January or June-July), the timing of the new fiscal year (June-July), the timing of school year (August-June), and the timing of quitting efforts tied to New Year’s resolutions (December-January). In the obvious extension to this research, the determinants of this potentially important statistical phenomenon will be analysed in detail.
The present findings demonstrate that sales of cigarettes in the USA have a strong seasonal component. This has potential implications for the timing of cessation initiatives and other time dependent policies. The phenomenon of seasonality could hold the key to significant advances in tobacco control and in the management of a leading public health problem.
Summary statistics on seasonality of cigarette sales

Months with high and low seasonal factors (with possible reasons for prominent months).
Acknowledgments
The authors gratefully acknowledge the support of the Substance Abuse Policy Research Program of the Robert Wood Johnson Foundation for supporting this work. Comments from Jonathan Caulkins and the excellent research assistance of Ascarya and Djamaludin Abubakar are also gratefully acknowledged.