Article Text

Abstract
Objectives The objectives of this study were: (1) to characterise the exposure of non-smokers exposed to secondhand smoke (SHS) in a vehicle using biomarkers, (2) to describe the time course of the biomarkers over 24 h, and (3) to examine the relationship between tobacco biomarkers and airborne concentrations of SHS markers.
Methods Eight non-smokers were individually exposed to SHS in cars with fully open front windows and closed back windows over an hour from a smoker who smoked three cigarettes at 20 min intervals. The non-smokers sat in the back seat on the passenger side, while the smoker sat in the driver's seat. Plasma cotinine and urine cotinine, 3-hydroxycotinine (3HC) and 4-(methylnitrosoamino)-(3-pyridyl)-1-butanol (NNAL) were compared in samples taken at baseline (BL) and several time-points after exposure. Nicotine, particulate matter (PM2.5) and carbon monoxide (CO) were measured inside and outside the vehicle and ventilation rates in the cars were measured.
Results Average plasma cotinine and the molar sum of urine cotinine and 3HC (COT+3HC) increased four-fold, urine cotinine increased six-fold and urine NNAL increased ∼27 times compared to BL biomarker levels. Plasma cotinine, urine COT+3HC and NNAL peaked at 4–8 h post-exposure while urine cotinine peaked within 4 h. Plasma cotinine was significantly correlated to PM2.5 (Spearman correlation rs=0.94) and CO (rs=0.76) but not to air nicotine. The correlations between urine biomarkers, cotinine, COT+3HC and NNAL, and air nicotine, PM2.5 and CO were moderate but non-significant (rs range = 0.31–0.60).
Conclusions Brief SHS exposure in cars resulted in substantial increases in levels of tobacco biomarkers in non-smokers. For optimal characterisation of SHS exposure, tobacco biomarkers should be measured within 4–8 h post-exposure. Additional studies are needed to better describe the relationship between tobacco biomarkers and environmental markers of SHS.
- Cotinine
- Secondhand smoke
- Nicotine
Statistics from Altmetric.com
Introduction
Secondhand smoke (SHS) exposure is associated with an increased risk of respiratory infection, otitis media and asthma in children as well as acute myocardial infarction and lung cancer in adults.1–3 In the USA and many other countries around the world, there has been substantial progress in limiting SHS exposure in public places, such as restaurants and bars.4 However, in most places there is no protection from SHS exposure in motor vehicles. In the USA, only four states currently have smoke-free car laws when children are present.
On average, people spend more than 1 hour a day in motor vehicles.5 Smokers commonly smoke while driving or riding in automobiles, and passengers are often adult non-smokers and children.6 An automobile represents a small and often fully enclosed space if windows are closed, in which concentrations of SHS can be quite high, potentially posing a health threat for passengers. Several researchers have measured concentrations of SHS constituents in the air of motor vehicles, including total particular matter and nicotine.7–9 These levels are comparable to or higher than those reported in restaurants and bars in which smoking is permitted.10 ,11 Measuring air concentrations of pollutants is important in determining exposure but may be imprecise as a measure of systemic exposure or dosage in epidemiological studies of SHS and disease risk.
Systemic exposure to tobacco smoke is best estimated by using biomarkers of exposure such as nicotine, its metabolites and 4-(methylnitrosoamino)-(3-pyridyl)1-butanol (NNAL)—a metabolite of the tobacco-specific lung carcinogen, 4-(methylnitrosoamino)-(3-pyridyl)1-butanone (NNK).12 ,13 We are aware of only one study in which biomarkers of exposure to SHS in motor vehicles has been reported. This was a study of urine cotinine concentrations after heavy exposure of non-smokers to SHS for 2 h in a tour bus.14
The aim of the present study was to examine multiple biomarkers of SHS exposure, including plasma and urine cotinine and urine NNAL over time after an experimental exposure to SHS in a stationary automobile with open front windows. Air levels of environmental markers of SHS were also measured to examine the relationships between environmental and biological markers of SHS exposure. Since the biomarkers of exposure are tobacco smoke-specific, no control condition was deemed necessary.
Methods
Overview
The study was conducted in the Clinical Research Center at San Francisco General Hospital and in an automobile parked in the hospital parking lot. Non-smoking participants sat in the back seat of the car with the front windows fully open and the back windows closed, while a smoker sat in the front seat and smoked three cigarettes over the course of an hour. Blood, urine and air samples were collected to measure cigarette smoke exposure in the non-smokers. The study was approved by the Committee on Human Research at the University of California, San Francisco. Written informed consent was obtained from each participant; all participants were financially compensated for their time.
Subjects
There were 10 participants, including eight non-smokers and two active smokers. The active smokers’ involvement in the study was limited to smoking cigarettes in the car during the 1-h SHS exposure period. The non-smokers included four men and four women who were all healthy and had prior histories of SHS exposure. Based on prior studies of levels of biomarkers after a single exposure, a sample size of eight was judged to be adequate to characterise representative biomarker changes in non-smokers. Prior exposure was required to ensure that we were not exposing subjects to an unfamiliar risk. Non-smoking status was determined by self-report and confirmed by plasma cotinine concentrations. Exclusion criteria included a history of recent respiratory illness, history of major medical or psychiatric conditions, body mass index >30, pregnancy or lactation, current illicit drug or alcohol abuse, inability to speak English or a history of fainting.
Study procedures
The non-smoking participants arrived at the Clinical Research Center by 07:00. An intravenous line for blood sampling was placed in a forearm vein and baseline (BL) blood and urine samples were collected. Between 08:00 and 09:00, the participant was escorted to the hospital parking lot and asked to sit in the back seat on the passenger side of the car, while the smoker sat in the driver's seat. Air monitoring equipment was placed in the back seat next to the non-smoker. The front windows were fully open, while the back windows were closed for the duration of the SHS exposure session. The same brand of cigarettes, Marlboro Regulars, was smoked at each exposure session. Three cigarettes in total were smoked at 20-min intervals, starting at time zero. The nonsmoker exited the car 60 min after the lighting of the first cigarette and immediately returned to the research ward for a 24-h stay.
The automobile
Rental cars that permitted smoking were obtained for the study. While the make and model of rental cars used varied, we selected cars with comparable interior volumes. The vehicles included a 2007 Ford Taurus, a 2007 Pontiac Grand Prix, and 2007, 2008 and 2009 Chevrolet Malibus. A different vehicle was used for each subject. The volume of the passenger compartment ranged from 2.75 m3 to2.92 m3 for these vehicles.15
Air measurements
Air in the cars was sampled for nicotine, carbon monoxide (CO) and particulate matter less than 2.5 μm in aerodynamic diameter (PM2.5). Monitors were collocated in the middle of the back seat, and tube inlets were placed at the approximate breathing height of the seating non-smoking participant (∼0.5 m from the seat). We simultaneously conducted ambient air monitoring for background concentrations of nicotine, CO and PM2.5 using monitors collocated 10 m away from the automobile.
Time-integrated vehicle and ambient nicotine were actively sampled on 37-mm Pall Emfab filters (Pall Life Sciences, Ann Arbor, MI) impregnated with sodium bisulphate using TSI SidePak pumps (TSI Incorporated, Shoreview, Minnesota, USA) with the flow rate set at 2 l/min. Vehicle and ambient real-time CO were measured using Hobo CO Data Loggers, model H11-001 (Onset Computer Corp, Bourne, Massachusetts, USA), which were programmed to record CO levels continuously every second starting 15 min before the first cigarette was smoked and during the 60-min exposure period. Two additional CO monitors were used in the car, one centred on the dashboard and the other centred on the shelf behind the back seat. These monitors were used to measure CO concentration and decay—a measure used for determining average air changes per hour (ACH).
PM2.5 inside the cars was measured using a Grimm Series 1.108 Aerosol Spectrometer (Grimm Technologies Inc., Douglasville, Georgia, USA) set to record PM2.5 concentrations every 6 s at 1.2 l/min. PM2.5 concentrations outside the car were measured using a personal DataRAM monitor (pDR-1200, Thermo Electron Corp., Franklin, Massachusetts, USA), in conjunction with a Pall 2.0-μm, pore 37-mm polytetrafluoroethylene (PTFE) filter and TSI SidePak SP350 pump (5 l/min). We corrected the real-time PM2.5 levels reported by the Grimm and DataRAM aerosol monitors by the gravimetric readings obtained from analysis of PM2.5 on the DataRAM filters collected during the exposures to ensure that the measurements from both instruments were comparable. In two subjects, PM2.5 data were not available due to equipment malfunction. Details of air sampling measurement methods are described in more detail elsewhere.16
Biomarker measurements
Blood samples were taken immediately before entering the vehicle (BL); and 15, 30, 45, 60 and 90 min, and 2, 3, 4, 6, 8, 12, 16 and 24 h after exiting the vehicle. Plasma was analysed for concentrations of nicotine and cotinine. Urine was collected at BL and then in blocks of 0–4, 4–8, 8–12 and 12–24 h. Urine was analysed for concentrations of cotinine, trans-3′-hydroxycotinine (3HC), NNAL and creatinine.
Analytical chemistry
Air nicotine concentrations were measured through a chemical extraction and gas chromatography with a capillary column and nitrogen–phosphorus detection quantification as described previously.17 The limit of quantification (LOQ) for airborne nicotine mass and concentration were 0.005 μg and 0.038 μg/m3, respectively. Plasma nicotine was measured by gas chromatography–mass spectrometry with a lower limit of quantitation (LLOQ) of 0.2 ng/ml, as described previously.18 Plasma cotinine was measured by liquid chromatography–tandem mass spectrometry (LC-MS/MS) and the LLOQ was 0.02 ng/ml.18 Total (free plus conjugated) urine cotinine and 3-HC were measured using LC-MS/MS, and had LLOQ of 0.05 ng/ml and 0.10 ng/ml, respectively.18 Total urine NNAL was measured by LC-MS/MS as previously described and had an LLOQ of 0.25 pg/ml.19
Statistical analysis
Data analysis of air measurements are described in detail elsewhere.16 In brief, the time-integrated concentrations of analytes in ambient air were subtracted from concentrations of these analytes in the vehicles to control for ambient levels. Ventilation rates in ACH were estimated using the CO levels as a tracer and calculated by determining the slope of the semi-log plot of the natural log of CO concentration (averaged over 15 s) over time following the extinction of each cigarette smoked.20 The ACH for each location (front, middle and back) was determined using the final cigarette smoked in each exposure period.
Descriptive statistics were computed for SHS constituents in the vehicles and for biomarkers of SHS exposure among the non-smokers. Descriptive statistics for biomarkers were computed for BL concentrations, maximum concentration following SHS exposure and time of maximum concentration, and maximum change. For any values below the LOQ, the LOQ/√2 was used. Because of the small sample size (n=8), Spearman correlation coefficients were used to examine relationships between 1-h time-integrated air measurements and exposure biomarkers.
Results
The eight non-smokers enrolled in the study were equally distributed by sex and included two Hispanic white subjects, two non-Hispanic white subjects, three Asian subjects and one person of mixed race. They had the following characteristics (as mean and range): age, 26 years (18–34 years); weight, 69 kg (48.2–82.4 years); body mass index, 24.1 (18.8–27.5).
Air measurements and ventilation
Time-integrated air concentrations of nicotine, PM2.5 and CO, and average ventilation rates over the 60-min exposure period for each subject are shown in table 1. Controlling for ambient concentrations as described before, the average vehicle concentrations of SHS constituents over the 1 h exposure period were as follows (mean±SD): nicotine, 9.5±5.4 μg/m3; PM2.5, 746±281 μg/m3; CO, 1.4±0.7 ppm. Air changes in the vehicles averaged 7.5 (range 4.7–10.6) ACH in the front, 2.7 (1.8–3.6) ACH in the middle, and 1.9 (1.3–3.2) ACH in the back.
Constituents of secondhand smoke (SHS) in air and air changes per hour (ACH) in stationary cars
Biomarker levels
Table 2 presents individual and average data on plasma cotinine, urine cotinine, molar sum of urine cotinine and 3-HC (COT+3HC) and total urine NNAL, including concentrations at BL before SHS exposure, the maximum concentration after exposure to SHS, and the maximum change in the concentration from BL to peak concentrations. We analysed the sum of urine cotinine and 3HC because it has been shown to correlate better with systemic nicotine dose than cotinine alone.21
Plasma cotinine, urine cotinine plus 3-hydroxycotinine (COT + 3HC) and urine total 4-(methylnitrosoamino)-(3-pyridyl)1-butanol (NNAL) at baseline (BL), maximum concentration (Cmax) and maximum change (Δmax) following 1 h exposure to secondhand smoke in a vehicle
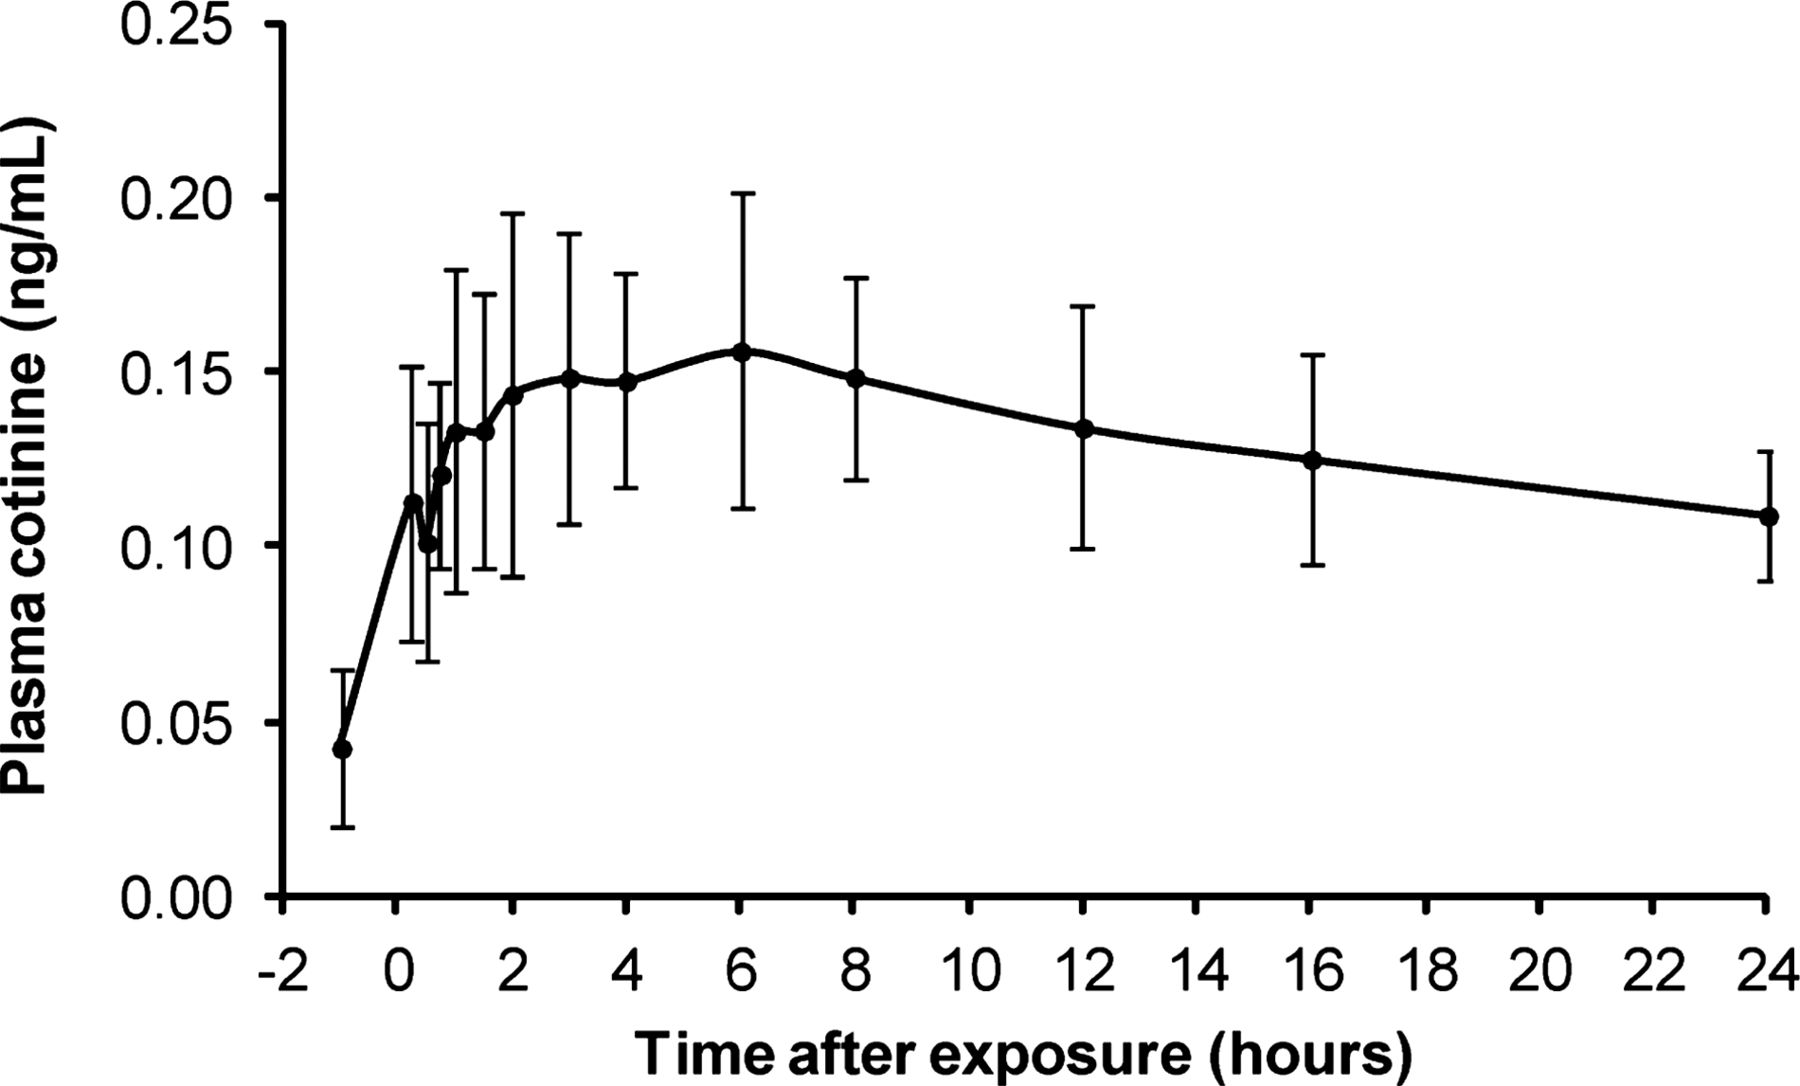
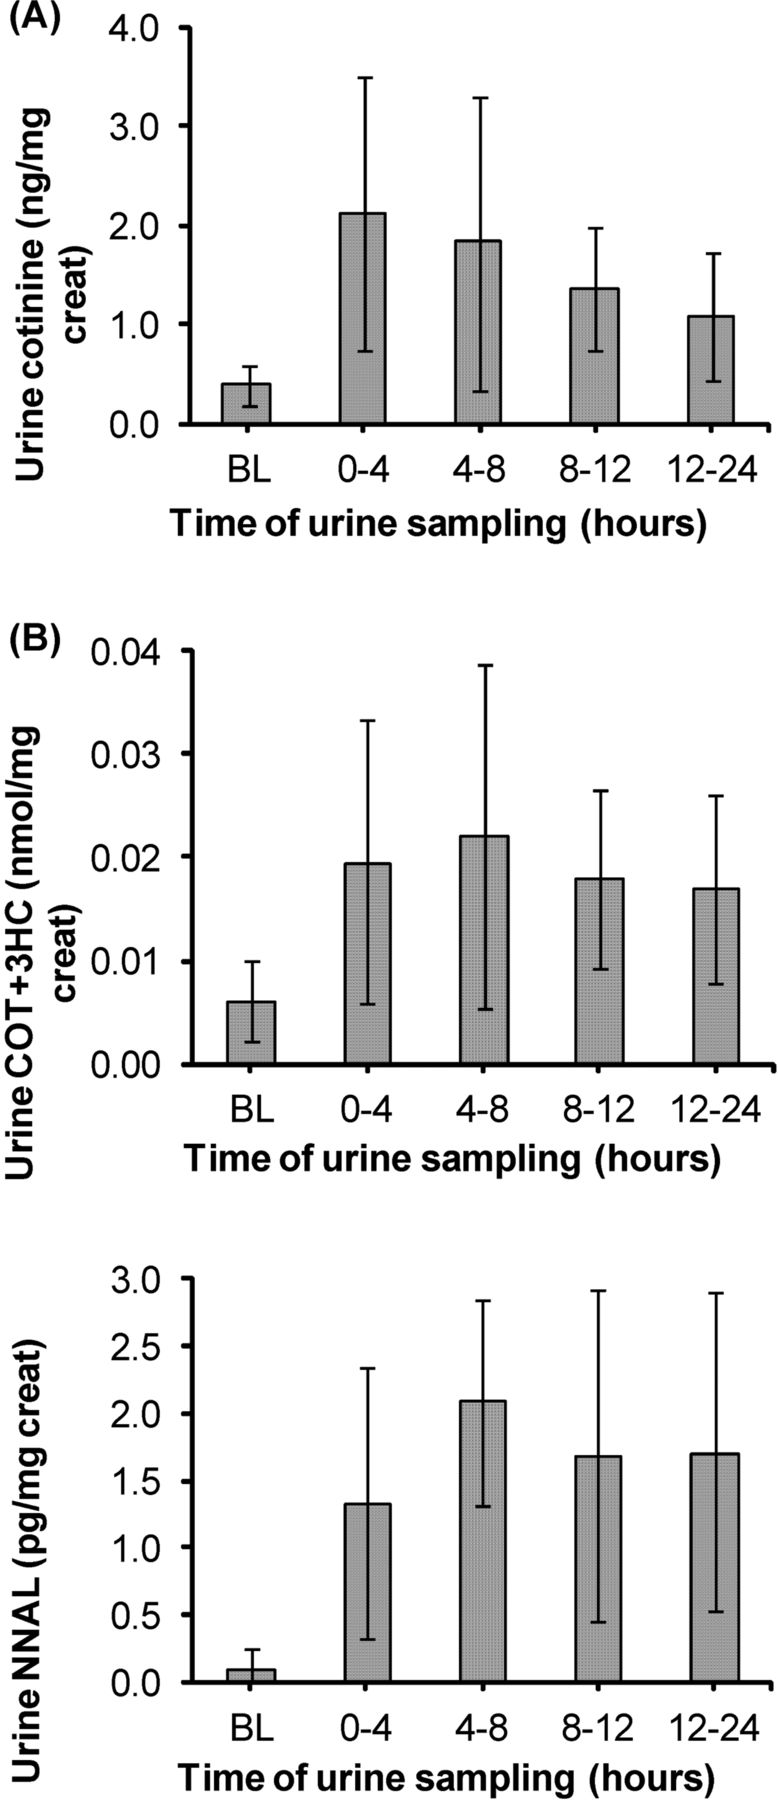
Plasma nicotine concentrations did not change after SHS exposure. Plasma cotinine increased from an average of 0.04±0.03 ng/ml at BL to an average maximum concentration of 0.17±0.05 ng/ml, a four-fold increase, occurring at a median of 4.5 h after exposure (range = 3–9 h). The time course of plasma cotinine from BL up to 24 h after SHS exposure is presented in figure 1. The average BL urine cotinine was 0.38±0.25 ng/mg creatinine and increased six-fold to an average maximum concentration of 2.4 ng/mg creatinine. Peak urine cotinine concentrations were measured in the 0–4 h post-exposure urine samples (figure 2A). Urine COT+3HC increased from 0.006±0.005 nmol/mg creatinine at BL to a maximum concentration of 0.025±0.020 nmol/mg creatinine, a four-fold increase. The peak urine COT+3HC concentrations were measured in the 4–8 h post-exposure urine samples (figure 2B). Urine NNAL increased from an average of 0.10±0.19 pg/mg creatinine at BL to an average maximum concentration of 2.68±1.36 pg/mg creatinine, a 26.8-fold increase. The peak urine NNAL concentrations were also measured in the 4–8 h post-exposure urine samples (figure 2C).

Time course of plasma cotinine among eight non-smokers exposed to 1 h of secondhand smoke (SHS) in a car. Time 0 h represents the end of SHS exposure and the beginning of post-exposure monitoring.

Measurement of (A) cotinine (ng/mg creatinine); (B) the molar sum of cotinine and 3-hydroxycotinine (COT+3HC) (nmol/mg creatinine) and (C) 4-(methylnitrosoamino)-(3-pyridyl)1-butanol (NNAL) (pg/mg creatinine) in urine at baseline before exposure and in four sampling intervals over 24 h after exposure.
Correlations between environmental markers and biomarkers
Spearman correlation coefficients between airborne concentrations of SHS and biomarkers of SHS exposure are presented in table 3. Time-integrated PM2.5 measured in the cars was significantly correlated to the maximum change in plasma cotinine (rs=0.94); had moderate to high but non-significant correlations with CO, urine cotinine, COT+3HC and NNAL; and was poorly correlated with air nicotine. Air nicotine was poorly correlated to air measurements of SHS and plasma cotinine, but moderately correlated to urine cotinine, COT+3HC and NNAL (these correlations were non-significant). Urine NNAL was not significantly correlated to plasma cotinine, urine cotinine or COT+3HC. Spearman correlations between ACH measured in the back seat, and environmental markers and biomarkers of SHS were as follows: PM2.5, rs=0.71 (not significant (ns)); air nicotine, rs=0.38 (ns); CO, rs=0.34 (ns); plasma cotinine, rs=0.32 (ns); urine cotinine, rs=0.57 (ns); urine COT+3HC, rs=0.54 (ns); and urine NNAL, rs=0.76 (p=0.049).
Spearman correlation coefficients (rs) between environmental markers and biomarkers of secondhand smoke (presented as rs and p-value)
Discussion
We present novel data from non-smokers exposed individually to SHS over a 1-h period in a car with open front windows and closed back windows including (1) the uptake of tobacco-specific compounds, including the carcinogen NNK, (2) the time course of SHS biomarkers in the non-smokers, and (3) the relationships between air concentrations of the SHS constituents and SHS biomarkers in these participants. Plasma cotinine and urine COT+3HC increased four-fold, urine cotinine increased six-fold and urine NNAL increased by an average of ∼27 times compared to BL pre-exposure concentrations of these biomarkers. Plasma cotinine, urine COT+3HC and urine NNAL peaked at 4–8 h after exposure ended, while urine cotinine peaked within about 4 h after exposure. The findings of this study are useful for exposure estimates and health risk assessments of SHS exposure in cars, as well as identifying optimal sampling times to capture maximum changes in plasma and urine tobacco biomarkers following SHS exposure in future studies.
Cotinine, 3-HC and NNAL are tobacco-specific biomarkers that have been used to characterise systemic exposure to tobacco smoke constituents in active and passive smokers. Cotinine, the proximate metabolite of nicotine, has, on average, a half-life of 16 h and is eliminated from the body within 3–4 days following the last exposure.12 We measured cotinine in both plasma and urine in this study. We showed that the average maximum change in plasma cotinine following 1 h of SHS exposure was 0.13 ng/ml. Plasma cotinine has not been previously reported after exposure to SHS in vehicles. Serum cotinine concentrations in non-smokers exposed to aged and diluted sidestream smoke in an environmental chamber have been reported.22 In that study, the air nicotine and serum cotinine levels were more than 10 times higher than what we observed in our study. Plasma cotinine values reported here were also about 10 times lower than changes in saliva cotinine measured in non-smokers exposed to 3 h of SHS inside bars that permitted smoking23 and also lower than changes in saliva cotinine of casino employees exposed to SHS at work.24 Studies have shown that plasma and saliva cotinine levels are highly correlated, with a range of 1.1–1.4 for the saliva-to-blood ratio,25 hence our direct comparison of the two matrices. On the other hand, the average changes in plasma cotinine we report here were very similar to the changes in saliva cotinine observed in non-smokers exposed to SHS for 3–6 h outside bars with relatively heavy outdoor smoking.26 ,27
Urine cotinine increased six-fold and urine COT+3HC increased four-fold compared to BL. Following exposure to SHS from 78 smoked cigarettes over 2 h in a closed bus, Willers and colleagues reported maximum urine cotinine levels (∼70 nmol/ml) that were several orders of magnitude higher than what we report in this study.14 Air nicotine measured in the bus by Willers and colleagues was ∼10 times higher than what we report here (110 μg/m3 vs 9.5 μg/m3). However, our exposure scenario (ie exposure to three smoked cigarettes over 1 h) is a more likely exposure scenario for children and non-smoking adults riding in an automobile with a person who is smoking, thus making our data more useful for risk characterisation than the previous study.
For six of eight non-smoking participants, the BL urine NNAL level was below the LOQ. After SHS exposure, urine NNAL increased an average of ∼27-fold among all participants. NNAL is useful as a specific marker of tobacco smoke exposure, and because both NNAL and its parent compound, NNK, are potent pulmonary carcinogens, NNAL provides direct evidence of carcinogen exposure.2 ,13 Since there is no known safe level of exposure to SHS, measurement of NNAL after brief exposure to SHS in a motor vehicle is important for health risk assessment. The half-life of NNAL is 10–16 days.28 While urine NNAL has not previously been reported after SHS exposure in cars, studies of indoor exposure to SHS among non-smokers have previously shown urine NNAL changes ranging from 3.8 pg/mg creatinine to 12.3 pg/ml,29 ,30 similar to changes following 3 h of exposure to SHS outside a bar with heavy outdoor smoking.31 Much higher increases in urine NNAL were observed in non-smokers exposed to sidestream smoke in an environmental chamber.22 Together with the plasma cotinine, urine cotinine and COT+3HC data presented here, our measurement of increased NNAL excretion in these participants over time indicates significant systemic exposure to tobacco toxicants after SHS exposure over a relatively short period of time in cars.
We present correlations between air constituents of SHS and biomarkers of SHS. PM2.5 and CO were significantly correlated with plasma cotinine, while air nicotine had moderate but non-significant correlations with urine cotinine, COT+3HC and NNAL, and poor correlation with plasma cotinine. The non-significant correlations between air nicotine, and plasma and urine nicotine metabolites is most probably related to the small number of subjects, the relatively narrow range of exposures and the large intrinsic inter-individual variability observed in biomarker levels. Another potential source of variability in the relationship between air concentrations and biomarkers of exposure to nicotine and NNK is exposure from the surfaces of motor vehicles. The surfaces of cars in which smoking has occurred are contaminated with nicotine and NNK.32 Since different smokers’ vehicles were used for each subject, the extent of surface contamination and resultant emissions could have been quite different from subject to subject.
We observed considerable variability between subjects in concentrations of smoke constituents in air in the vehicles, despite a standard protocol for smoking cigarettes and window opening. The variables most probably related to this variability are the vehicles and the weather. As noted above, surface contamination of vehicles could have resulted in emissions that differed from vehicle to vehicle. The weather, most importantly the wind, also varied across days. Since the windows were open, differences in wind speed could have a large impact on air exchanges and airborne constituent measurements.
While it is not known what the precise health risks associated with the biomarker data presented here represent, asthmatic adults with low-level outdoor SHS exposure measured using a nicotine badge (average nicotine = 0.03 μg/m3) showed an increased risk of respiratory symptoms and additional bronchodilator use.33 Average air nicotine measured in our study (9.5 μg/m3) was much higher than 0.03 μg/m3, indicating that SHS exposure in cars may reach levels associated with significant health risks, particularly among children with asthma and other respiratory problems. Studies have also shown large immediate cardiovascular effects of acute low-level SHS exposure among adults.3 ,34
Our study provides benchmark data for assessing biomarkers of exposure to SHS. We find that a plasma sample for cotinine concentration obtained at 4–5 h, or a urine sample for cotinine, COT+3HC and NNAL obtained within 4–8 h after exposure demonstrated the maximum concentration for most participants. Willers and colleagues had previously concluded that the time of sampling is not very critical for urine cotinine.14 While this may be true for high SHS exposure conditions, such as in Willers and colleagues’ study, exposure to lower-level SHS can be underestimated based on the time of sampling. Hence the optimal sampling times presented here are valuable to obtaining more accurate estimates of systemic exposure and health risk assessments.
In addition to the small sample size, our study's generalisability is limited because we studied SHS exposure in a stationary vehicle. The ventilation in our vehicle ranged from an average of 7.5 ACH in the front top 1.9 ACH in the back. In contrast, in a vehicle driving at 20 miles per hour with windows closed, the ACH is 13. Nonetheless, the air concentrations of PM2.5, CO and nicotine that we measured are consistent with other studies of PM2.5, CO, and air nicotine after a cigarette is smoked and at various ventilation conditions.8 ,35–37 Air concentrations of SHS constituents in vehicles are lower at higher ventilation rates, which are influenced by window configurations and vehicle driving speed.
In conclusion, we show that brief exposure to SHS in a motor vehicle results in substantial increases in plasma cotinine and urine cotinine, COT+3HC and NNAL in non-smokers. Such measurements are best done within 4–8 h after exposure, when peak levels are observed. These measurements can be used in field studies to document exposures and to conduct risk assessments that can be used to strengthen public health policies directed at protecting non-smokers, especially children, from the harmful effects of SHS exposure.
What this paper adds
-
The paper provides the first description of levels and time course of biomarkers of tobacco toxicant exposure in nonsmokers after a well-characterised brief exposure to SHSin an automobile.
-
These data will be useful for field studies of exposure and associated risk from SHS exposure that can be used to strengthen public health policies to protect nonsmokers.
Acknowledgments
The authors thank Cotys Winston for assistance in conducting the clinical studies; Charles Perrino, Minjiang Duan, Chris Havel, Lita Ramos and Lisa Yu for performing analytical chemistry; Faith Allen for data management and Marc Olmsted for editorial assistance.
References
Footnotes
-
Contributors NB, IJ, DD and SKH designed the study. IJ, MM and DD managed human subject-related activities. PJ and CH contributed substantially to analytical chemistry activities. IJ, GSH, MM, DD, AN, SKH, PJ and NB participated in various aspects of data analysis and interpretation. All authors contributed to the writing of the manuscript.
-
Funding This work was supported by the Flight Attendants Medical Research Institute and US Public Health Service grant DA12393 from the National Institute on Drug Abuse and grant R25 CA 113710 from the National Cancer Institute, National Institutes of Health. The study was carried out in part at the General Clinical Research Center at San Francisco General Hospital Medical Center (NIH/NCRR UCSF-CTSI UL1 RR024131).
-
Competing interests None.
-
Ethics approval Institututional Review Board—University of California San Francisco.
-
Provenance and peer review Not commissioned; externally peer reviewed.