Article Text

Abstract
Background Despite compelling evidence on the health hazards of tobacco products accumulated over the past 70 years, smoking remains a leading cause of death worldwide. Policy action to control smoking requires timely, comprehensive, and comparable evidence on smoking levels within and across countries. This study provides a recent assessment of that evidence based on the methods used in the Global Burden of Disease (GBD) Study.
Methods We estimated annual prevalence of, and mortality attributable to smoking any form of tobacco from 1970 to 2020 and 1990–2020, respectively, using the methods and data sources (including 3431 surveys and studies) from the GBD collaboration. We modelled annual prevalence of current and former smoking, distributions of cigarette-equivalents per smoker per day, pack-years for current smoking, years since cessation for former smokers and estimated population-attributable fractions due to smoking.
Results Globally, adult smoking prevalence in 2020 was 32.6% (32.2% to 33.1%) and 6.5% (6.3% to 6.7%) among men and women, respectively. 1.18 (0.94 to 1.47) billion people regularly smoke tobacco, causing 7.0 (2.0 to 11.2) million deaths in 2020. Smoking prevalence has declined by 27.2% (26.0% to 28.3%) for men since 1990, and by 37.9% (35.3% to 40.1%) for women. Declines have been largest in the higher sociodemographic countries, falling by more than 40% in some high-income countries, and also in several Latin American countries, notably Brazil, where prevalence has fallen by 70% since 1990. Smoking prevalence for women has declined substantially in some countries, including Nepal, the Netherlands and Denmark, and remains low throughout Asia and Africa. Conversely, there has been little decline in smoking in most low- and middle-income countries (LMICs) with over half of all men continuing to smoke in large populations in Asia (China, Indonesia), as well as the Pacific Islands.
Implications While global smoking prevalence has fallen, smoking is still common and causes a significant health burden worldwide. The unequal pace of declines across the globe is shifting the epidemic progressively to LMICs. Smoking is likely to remain a leading cause of preventable death throughout this century unless smoking cessation efforts can significantly and rapidly reduce the number of smokers, particularly in Asia.
Funding XD and EG received funding through grant projects from Bloomberg Philanthropies (funding no. 66-9468) and the Bill & Melinda Gates Foundation (funding no. 63-3452).
- surveillance and monitoring
- disparities
- global health
- socioeconomic status
- public policy
Data availability statement
Data are available upon reasonable request.
Statistics from Altmetric.com
Introduction
Shortly after epidemiological research during the 1950s established cigarette smoking as a major cause of death, particularly in countries where smoking had become widespread, public health agencies in countries such as the UK and the USA issued major reports documenting the health hazards of smoking.1 2 Although the hazards were first widely documented more than 50 years ago, smoked tobacco products, including manufactured and hand-rolled cigarettes, pipes, cigars, waterpipe, bidis, kreteks and other local smoked tobacco products, remain common in many countries. This has been accompanied by substantial death and disability directly attributable to tobacco products, to the point where smoking is the leading cause of disease burden in many countries.3–7 Beginning with the seminal work of Doll and Hill8 in the UK and Hammond and Horn9 in the USA, which provided early, compelling evidence on how persistent smoking affects health and survival, numerous studies have described the individual mortality risks from smoking and how these have evolved.10–15 Others quantify the impact of smoking on national, regional and global mortality levels.16–18 The sheer volume of death and disability attributable to tobacco underscores the importance of tobacco control as an urgent global health priority. Based on recent trends in smoking uptake among young people, and assuming that the addiction will eventually kill half of all smokers, cigarette smoking is estimated to have caused over 100 million deaths last century and will cause over 1 billion deaths this century unless more effective measures are taken to end the tobacco epidemic.19
Policy action to control smoking has been complicated, and occasionally confused, by the powerful temporal and political characteristics of the epidemic, with a long lead time between populations taking up smoking and subsequently experiencing the full disease effects, and a powerful industry opposing effective public health measures. Nearly three decades ago, Lopez et al proposed a series of stages of the tobacco epidemic over the course of the 20th century that showed how prevalence and mortality had evolved for men, and then, two to three decades later, for women as well.20 This temporal characterisation of the epidemic, and a subsequent update almost two decades later that incorporated emerging evidence from low- and middle-income countries,21 has served to better inform and stimulate policy action to reduce smoking prevalence, disease and deaths.22
Smoking control efforts ought to be guided by a more granular description of how smoking prevalence and consumption have evolved. Country-specific evidence on changes in smoking levels and patterns according to age, sex, geography and socioeconomic status is critical to stimulate and monitor the effectiveness of policies to reduce population exposure to tobacco hazards. Where, for example, is smoking prevalence for women increasing, or decreasing, at a faster rate than for men? Are smoking rates rising among adolescents while falling among adults? Are trends in smoking rates similar across socioeconomic groups? Have there been important changes in consumption patterns, with more (or fewer) daily smokers than was the case earlier? Reliable and timely information on key aspects of the tobacco transition will provide countries with critical intelligence for policy, including the effectiveness of past tobacco control efforts and how they might need to be modified, particularly to target population subgroups with the greatest needs.
This study provides a comprehensive and comparable assessment of how the global smoking epidemic has evolved over the past 50 years, characterising more than 200 countries and territories according to their epidemic phase, and detailing how smoking prevalence and its attributable burden has changed for men and women at different ages, and, importantly, for populations at different levels of development.
Methods
Overview
The Global Burden of Disease, Injuries and Risk Factors (GBD) Study is a systematic analysis of 369 diseases, injuries, and 87 risk factors in 204 countries and territories.3 23 As part of the GBD 2020, we estimated the prevalence of and the health burden (deaths and disability-adjusted life years, ie, DALYs) attributable to smoked tobacco use from 1970 to 2020 and from 1990 to 2020, respectively, for 204 countries and territories by 5-year age group and sex. Secondhand smoke exposure, smokeless tobacco (e.g., snus), electronic cigarettes, vaping products and heated tobacco products also contribute to the overall disease burden but were excluded from this analysis. Henceforth, we use the term ‘smoking’ to refer to ‘smoked tobacco use’ of one or more of the products mentioned earlier.
We used a direct estimation method for 36 health outcomes caused by smoking that have a dose–response relationship with both current and former smoking. Full details of the estimation method are described elsewhere.3 4 We summarise the key modelling steps: estimating prevalence of current and former smoking; modelling distributions of smoking exposure including cigarette-equivalents of tobacco smoked per day, pack-years for current smoking and years since cessation for former smoking; calculating population-attributable fractions (PAFs) using the classic attributable risk formula based on prevalence estimates and relative risks from an appropriate source.24
Prevalence of smoked tobacco use
To estimate prevalence of current and former smoking, we performed a systematic review of the literature and extracted data on key smoking indicators, only including surveys that were nationally or subnationally representative (state/province level). Surveys conducted among specific populations (e.g., pregnant women, physicians) were excluded. A total of 2808 surveys, covering 200 of 204 countries and territories were included in this analysis. We extracted individual-level microdata or report tabulations from the surveys for people aged 10 years and above. We excluded estimates with sample size less than 10 to avoid unstable estimates. Following data extraction, systematic data quality checks were performed to identify and exclude implausible or inconsistent data. A complete list of data sources used in this study can be found in the online supplemental materials and data are available in Global Health Data Exchange (http://ghdx.healthdata.org/). More detailed information on the search strategy, inclusion criteria and data extraction methods can be found elsewhere.4
Supplemental material
Supplemental material
To ensure data comparability and to avoid compositional bias, we mapped all non-reference case definitions to our reference case definitions. We then applied spatiotemporal Gaussian process regression (ST-GPR) to model prevalence for both current and former smoking.3 23 We produced 1000 draws from the posterior distribution of ST-GPR and used the 25th and the 975th draws to construct uncertainty intervals around the final estimates. Details of these methods and ST-GPR are published elsewhere.25 26
Exposure distribution
To estimate deaths and DALYs attributable to smoking, we first estimated the distributions of intensity of smoking and number of years since cessation among current and former smokers, respectively. To capture smoking intensity, we estimated distributions of both cross-sectional cigarette-equivalents of tobacco per smoker per day and lifetime cumulative pack-years. We estimated the cigarette-equivalents consumed per smoker per day using two data sources, namely, self-reported consumption data from household surveys and supply side country-level tobacco consumption data from the Euromonitor (2002–2017), the US Department of Agriculture (1960–2005), and the Food and Agriculture Organization of the UN (1961–2013). To estimate distributions of pack-years, we simulated individual smoking history using distributions of cigarette-equivalents per smoker per day and age of smoking initiation. For the distribution of years since cessation, we simulated cessation behaviour of current smokers using survey data on age of cessation by sex, age group, country and year. Full details of how we modelled exposure distributions (i.e., tobacco use) have been published elsewhere.4
Dose–response risk curves
We used a new meta-regression method27 to re-estimate the dose–response risks of current smoking for 36 health outcomes caused by smoking, based on an updated systematic review of literature.3 4 We included 623 studies that report risk of smoking on the outcomes among both the overall population and subpopulations (e.g., nurses or workers) but removed those conducted among people with certain pre-existing conditions (e.g., diabetes). For former smokers, we modelled risk-reduction curves for years since cessation and standardised the risk at the time of cessation using the exposure-weighted risk integral for current smokers in each age, sex, location and year group. Bayesian methods provide uncertainty of estimates based on small sample size to avoid unstable estimates. Full details of the methods can be found elsewhere.28 Data sources used in this analysis can be found in online supplemental materials.
Population-attributable fractions
The detailed formula used to calculate PAFs is described elsewhere.4 To account for the delayed effect of smoking on health outcomes, we lagged the exposure based on the average length of follow-up across the studies included in the meta-regression. We calculated deaths and disease burden (DALYs) attributable to smoking by applying the PAFs to cause-specific deaths and DALYs by year, location, age group and sex. All analyses were performed using R (V.3.6–4.1) and Python (V.3.3).
Sociodemographic Index
Estimates are also provided by quintile of Sociodemographic Index (SDI), a composite measure of educational attainment, income per capita and total fertility rate under age 25 years.29 Since the SDI for a country can change over time, we grouped countries based on their SDI in 2020.
Guidelines for Accurate and Transparent Health Estimates Reporting compliance
This study complies with the Guidelines for Accurate and Transparent Health Estimates Reporting recommendations.30 Results presented in this manuscript are publicly available: https://vizhubhealthdataorg/gbd-compare/.
Results
To assess the evolution of the global smoking epidemic over the past half century, we estimated the fraction of the adult population who are smokers (prevalence) and the amount they smoke (consumption). Both metrics are relevant to inform and monitor tobacco control measures. Figure 1 shows prevalence levels, for women and men separately, in 1970 and again in 2020 (prevalence levels in 2000, by sex, are shown in online supplemental figure S1). For men, prevalence levels exceeded 40% in much of the world except sub-Saharan Africa, and were between 30% and 39% in India, as well as the USA, UK, Australia and New Zealand, where prevalence was as high as 60%–70% in the late 1940s.11 By 2000, male prevalence had already declined substantially in many countries, but remained high in Eastern Europe, Southeast Asia, China, Spain (among Western Europe) and parts of Latin America. Prevalence fell further by 2020, particularly in Latin America and India, with levels below 30%. For women, prevalence levels above 30% 50 years ago were only evident in severalOECD (the Organisation for Economic Co-operation and Development) countries including Canada, the USA, the UK, Australia and New Zealand—as well as many countries in Western Europe, notably Denmark and the Netherlands, where female smoking rates exceeded 40%, and in the southern cone of Latin America. By 2000, smoking rates in the USA and several other OECD countries fell below 30%, and fell below 20% by 2020, except for a handful of countries in Europe, including Spain, France, Switzerland, Poland and Hungary. Female smoking rates in Chile remained above 30%.
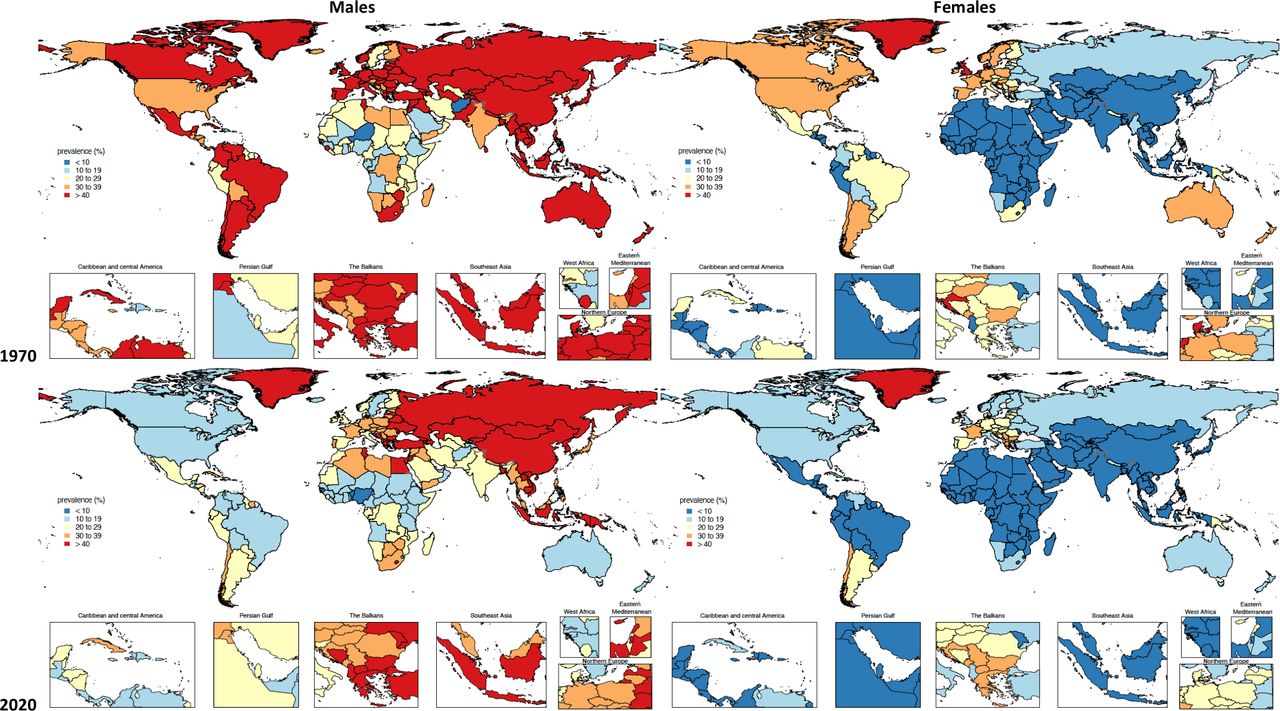
Age-standardised prevalence of current smoking for males and females aged 15 years and above, in 1970 and 2020. 1The standard population age weights used for calculating age-standardised prevalence are taken from the Global Burden of Disease study.23
In 2020, more than half of all adult men in parts of the Indo-Pacific region (Micronesia, Kiribati, Timor-Leste, Indonesia, Papua New Guinea, Solomon Islands) were smokers, as was the case for Armenia, Mongolia, Jordan (54%–56%) and China (52%). Female prevalence was highest (34%–40%) in Pacific Island countries (Nauru, Micronesia, Kiribati), but less than 2%–3% for women in several countries in Africa, as well as Tajikistan and Sri Lanka (see figure 1).
Figure 2 summarises the magnitude of change in trends in smoking prevalence over the past 20 years. For men, prevalence has declined by more than 10 percentage points in a number of countries since 2000 including Canada, Russia, the UK, Australia, Brazil and India; while in others, including China, much of Western Europe, the USA, Chile and Argentina, declines have been more modest. Parts of North Africa (Egypt, Libya, Iran) and East Asia have seen some increase in male prevalence since 2000, as has Botswana. On the other hand, female prevalence has not changed significantly since 2000 in most countries, or declined by less than 10 percentage points. Notable exceptions are Nepal, Brazil, Norway, Denmark, the Netherlands, New Zealand and the UK, where smoking levels among women have fallen by more than 10 percentage points.
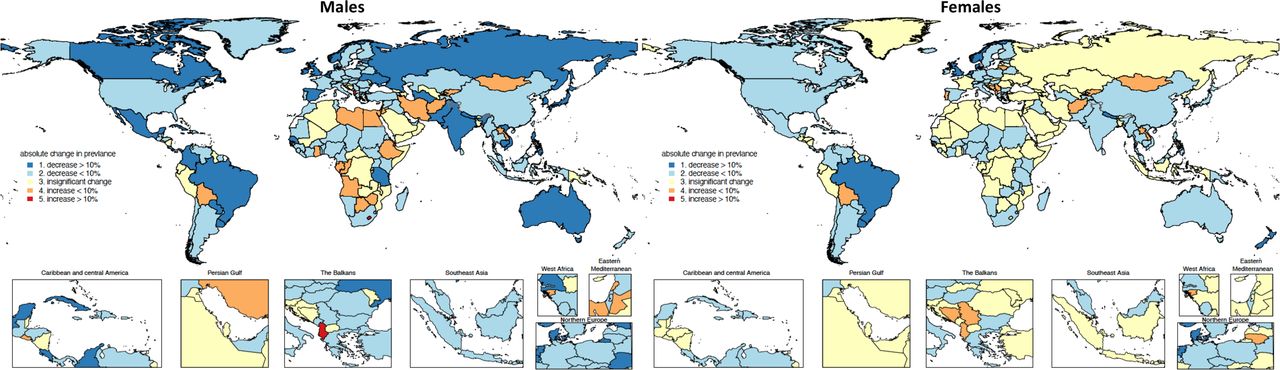
Absolute percentage points change of age-standardised prevalence of current smoking for men and women aged 15 years and above from 2000 to 2020. 1The percentage points change in prevalence between 2020 and 2000 is grouped into five categories according to the magnitude of the change and the statistical significance of the change. 2The standard population age weights used for calculating age-standardised prevalence are taken from the Global Burden of Disease study.23
Several countries have succeeded in reducing smoking rates over the past two decades, with the largest declines in age-standardised prevalence for men being observed in Japan (down 18.8 percentage points, 95% CI: 16.5 to 21.1), Ukraine (17.7 percentage points, 95% CI: 15.6 to 19.9), Nepal (17.5 percentage points, 95% CI: 15.3 to 19.8) and Brazil (17.5 percentage points, 95% CI: 16.0 to 19.1), as well as in Norway, Turkmenistan, Paraguay, Colombia and Denmark, all recording falls of around 15 percentage points since 2000. The largest declines in smoking prevalence for women (13–17 percentage points) occurred in Nepal, Norway, Denmark and Brazil, with reductions of 10 percentage points or so also observed in New Zealand, the UK, the Netherlands and Canada.
A key indicator of future smoking prevalence is the level of smoking among youth and adolescents, and especially whether those levels are rising. Online supplemental figure S2 shows trends in prevalence among youth since 2000 according to the magnitude of change. In most high SDI countries, as well as in Russia, Brazil and Mexico, youth smoking prevalence among men declined by more than 10 percentage points over the past 20 years. Otherwise, there has been no significant change in smoking among young men; and in some countries, including Iran, Algeria, Jordan and Bolivia, prevalence has increased significantly. Among women, youth smoking prevalence also declined by more than 10 percentage points in the majority of high SDI countries, but by less than 10 percentage points in Japan and Eastern and Central European countries. There has been little change in youth smoking levels among women over the past 20 years in most low- and middle SDI countries.
To assess how prevalence varies, and is evolving, across various socioeconomic groups in the population, prevalence trends since 1970 according to five SDI categories are shown in online supplemental figure S3. In 2020, male smoking prevalence was highest in the high-middle (second highest) SDI group, not the highest category, for whom reductions in prevalence are apparent since 1970. In other SDI groups, smoking prevalence only began to decline 20 years later, around 1990, except for the low SDI group where little change in prevalence is discernible. Among women, smoking prevalence in the high SDI group has fallen by about 50% since 1970, with little change evident for all other SDI categories.
Another way to assess the impact of smoking control policies is to examine how smoking rates have varied for successive birth cohorts of men and women, as shown in online supplemental figure S4. It illustrates a characteristic age-related pattern, with steep increases at younger adult ages until about age 30 years, then declining prevalence with advancing age, with very little change in the age pattern over the past century. There has, however, been a steady decline in prevalence, for both men and women, beginning with the birth cohort born around 1970. For men, this trend is most apparent for the high-middle and low-middle SDI countries. For women, the decline in prevalence is most noticeable for the high SDI category, being about 50% lower at age 20 years for the 2000 birth cohort than for women born a century earlier.
Changes in the consumption of smoked tobacco over the past 50 years can be seen from online supplemental figure S5a for different SDI groups. As noted for prevalence, male consumption is highest in the high-middle SDI group, being about twice as high as for other SDI categories. Consumption increased in this group of countries between 1970 and 1995, although it has declined since then. By far the largest declines in consumption have occurred in the high SDI group, falling by about 50%, compared with 25%–30% in other SDI groups. Female consumption is highest in the high SDI group, being about twice the level in other SDI categories, although consumption levels have fallen by about 60% since 1970. Reductions in female consumption in the middle SDI group have been almost as large (50%), but less so in the high-middle SDI category.
There has been little change over the past few decades in the number of cigarette-equivalents smoked per smoker per day, except for the high SDI category—although this decline appears to have stalled during the past 5 years—and the modest but steady increase in consumption in the high-middle SDI group (see online supplemental figure S5a).
Trends in consumption over the past half century in different geographical regions (as defined by the GBD Study) are shown in online supplemental figure S5b. In 2020, consumption among men was highest in Southeast and East Asia, rising sharply between 1970 and 1990, followed by modest declines. The next highest consumption levels for men are in Central and Eastern Europe, although there too some reduction in consumption has occurred since 2000. Consumption of tobacco by male smokers is lowest in sub-Saharan Africa and Latin America. In the latter region, consumption has declined by about two-thirds since 1970. The other country groups experiencing big declines in consumption among men are the high-income countries, where levels have fallen by about 60% since 1970. Similar reductions in consumption are also apparent for women in high-income countries, and in Latin America, but with little change in other regions.
There has been little change in the fraction of smokers who smoke daily versus less than daily (see online supplemental table 1). While there is some variation in the relative fraction of daily smokers across SDI groups, region and by sex, these proportions have remained relatively constant since 2000. The most noticeable change was an increase in the fraction of former smokers, most of whom were former daily smokers.
With concern for how trends in smoking prevalence and consumption affect the burden of disease in countries. Figure 3 shows how the fraction of deaths at ages 30 years and over that are attributable to smoking has changed over the past three decades, separately for men and women. In 1990, more than 20% of male deaths above age 30 years in several countries including the USA, Canada, much of Europe, Australia, New Zealand, Japan, Southern Latin America, China, Malaysia and the Philippines were attributable to smoking. Smoking-attributable mortality was 15%–19% in Brazil, South Africa, India and Indonesia. By 2020, the fraction of deaths due to smoking had declined to 15%–19% in the USA, Canada, the UK and most of Western Europe, and even lower, to 10%–14%, in Sweden, Norway, Finland, Australia and New Zealand. Smoking-attributable mortality was still high (exceeding one in five deaths) in Eastern and Central Europe, Spain, Egypt, the Philippines, China and Indonesia, but had fallen to less than 1 in 10 deaths in Mexico and tropical Latin America, and remained low in sub-Saharan Africa.

Per cent of deaths attributable to smoking for men and for women aged 30 years and above, in 1990 and 2020.
Among women, more than one in five deaths above age 30 years in 1990 were attributable to smoking in the UK and Denmark, reflecting their early, and substantial, female smoking epidemics. Smoking also claimed 15%–20% of deaths among women at these ages in the USA, Canada and Ireland, and 10%–15% in Australia, where the impact of smoking control measures was already apparent. By 2020, less than 10% of female deaths in Australia were attributable to smoking. In Chile, smoking-attributable mortality is rising following widespread increases in female prevalence (see figure 1). Typically, smoking currently causes 10%–14% of female deaths in the USA, Canada and Europe, but remains low as a cause of death—less than 5%—throughout Asia and Africa.
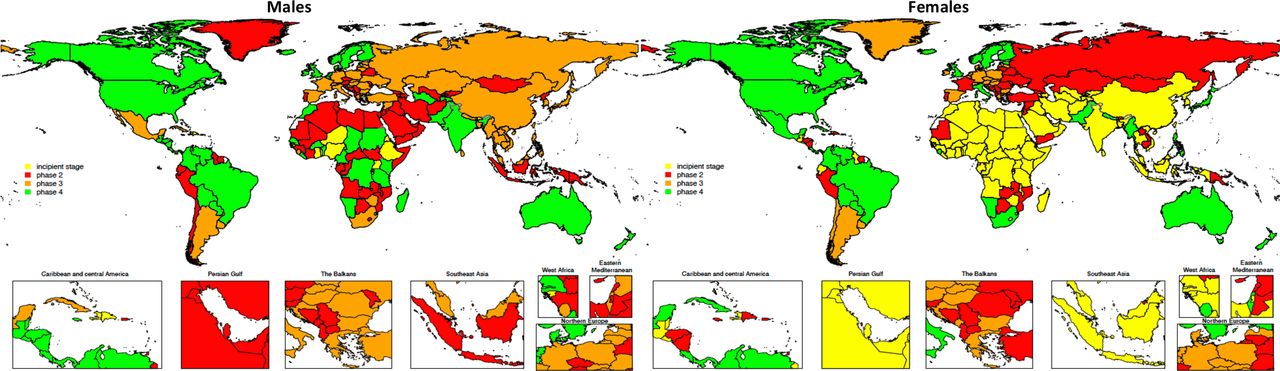
Based on changes in prevalence of smoking, we classified the 204 countries or territories according to their (current) phase of the tobacco epidemic in figure 4, for men and women separately. Table 1 summarises the prevalence levels and changes that characterise each of the four stages.

Classification of countries according to stages of the tobacco epidemic in 2020, by sex. 1For men, the definitions of four phases are (1) current prevalence <15%; (2) current prevalence now 15%–65% and never declined, or only declined by <10% points; (3) prevalence has declined by >10% points but is still >25%; (4) prevalence has declined by >10% points and is now <25%; for women, the definitions of four phases are (1) current prevalence <5%; (2) current prevalence now 5%–45% and never declined, or only declined by <5% points; (3) prevalence has declined by >5% points but is still >20%; (4) prevalence has declined by >5% points and is now <20%. 2The colour codes are based on the severity of the implications of smoking levels for policy, with red indicating the worst scenario, orange the second-worst scenario, yellow the neutral scenario and green the best scenario.
Operational definitions of four phases of the tobacco epidemic (and number of countries), by sex
Female prevalence data suggest that 40% of countries, half of them in sub-Saharan Africa, are still in the incipient stage of the epidemic, with very low prevalence. Large countries of Asia, including India, China, Bangladesh and Indonesia, belong in this phase. Another 31% (64 countries) have moved into phase two, with rising prevalence and little evidence of decline. One-quarter of these are Pacific Island countries, another quarter include Russia, and Central and Eastern European countries, and 10 countries are in Latin America. Interestingly, France and Portugal, alone among high-income countries, are at phase two, and six phase two countries are from sub-Saharan Africa. Among 27 phase three countries, 17 are high-income Western European nations, as well as Argentina, Chile and Uruguay, and 8 countries from Central/Eastern Europe. Only 33 countries (16% of total) have transitioned to phase four with comparatively low (<20%) prevalence, including the USA, the UK, Australia, Canada, New Zealand, Japan and all of Scandinavia, except Denmark. Italy, but no other Southern European nation, transitioned to phase four. Nine Latin American countries, including Mexico, Colombia, Brazil and Cuba, have also transitioned, as well as three from sub-Saharan Africa (South Africa, Namibia, Sierra Leone).
The epidemic classification of countries according to male prevalence reflects the earlier and more pervasive smoking practices of men compared with women. Only 17 (8%) countries still have male prevalence levels sufficiently low (<15%) to classify them as being in the initial phase. All are low or low-middle SDI countries, including 10 in sub-Saharan Africa, and 6 Caribbean countries, including Haiti and the Dominican Republic. Eighty-five (42%) countries have moved to phase two, with broad representation across all regions, indicating how pervasive the epidemic is. Thirteen Pacific Island countries or territories, 17 in sub-Saharan Africa, 15 from Central/Eastern Europe, 10 from Latin America and 16 from the Middle East/North African region have been classified phase two, as well as Indonesia and Timor-Leste, with the highest smoking rates in the world, and a handful of high-income countries, including Austria, Portugal, Cyprus and Chile.
Prevalence has started to decline in 52 countries (25%) classified into phase three, including 10 from Southeast Asia (including China), and 5 in the Pacific, including Fiji and Tonga. Almost one-third of countries (16) in this phase are high SDI nations of Western Europe, but also Japan, Argentina and Uruguay. Another 12 are from Central/Eastern Europe, including Russia, Hungary and Poland, and 2 (Mexico and Cuba) from Latin America.
One-quarter of countries (50) have reduced male smoking prevalence to below 25% (phase four), primarily the Anglo-Saxon nations, all of Scandinavia, including Denmark, as well as Singapore, Belgium and the Netherlands, where smoking rates had been among the highest in the world. This category contains 15 Latin American countries, including Brazil, Colombia and Costa Rica, 14 in sub-Saharan Africa and 2 (India, Pakistan) in Asia, suggesting that tobacco control measures have been applied with some success more globally. Overall, less than half of all countries (93) or territories were similarly classified based on male and female prevalence.
Discussion
Globally, 1.18 (95% CI: 0.94 to 1.47) billion people in 2020 regularly smoked some form of tobacco, causing 7.0 (95% CI: 2.0 to 11.2) million deaths, or about one in seven of all deaths that occurred that year.4 From smoking levels in excess of 40% among men around 1970 in many high SDI countries, prevalence has more than halved over the past 50 years and has declined substantially in Latin America. Conversely, with few exceptions, there has been little decline in smoking in most low- and middle- SDI countries, with more than half the adult male population in large populations of Asia (China, Indonesia) and Pacific Island countries smoking regularly. Smoking rates among women in the more high SDI countries never attained the levels of men, typically lagging male smoking by two to three decades. Smoking levels among women throughout Asia and Africa, with very few exceptions, have remained low. Prevalence levels for successive birth cohorts, particularly in high sociodemographic groups, have consistently declined beginning with those born around 1970. Prevalence has also declined among other sociodemographic categories, less so in the high-middle sociodemographic group. In terms of established models of the tobacco epidemiological transition, these data for men suggest that less than 10% of countries are at the incipient stage, 42% in stage two where prevalence is rising or has peaked and not yet declined, 25% in stage three where prevalence is declining, but still high, and another quarter where declines have pushed prevalence to below 25%. For women, the respective per cent distribution of countries across the phases is 40/31/13/16.
These divergent trends in prevalence across countries, sociodemographic groups and by age and sex, as well as the differential classification of countries according to phase of the epidemic, provide a number of important lessons for national, regional and global tobacco control policies. Most importantly, they strongly suggest that tobacco control measures, particularly when implemented comprehensively, work, collectively leading to a 27.2% (95% CI: 26.0% to 28.3%) global decline in smoking prevalence among men since 1990, and a much larger decline, 37.9% (95% CI: 35.3% to 40.1%) among women.31 32 The substantial declines observed among the higher sociodemographic group demonstrate their effectiveness among populations having greater access to health resources and choices that enhance health consciousness, responsiveness to health messages and avoidance of health risks than other sectors of the population. This is much less evident among the next sociodemographic category (high-middle), although this may well reflect compositional issues since the experience of China would dominate this category, at least in more recent years.
The phasing of the tobacco epidemic in countries that we have described here includes some important reminders for global tobacco control efforts. First, the large number of countries where female smoking levels are very low could well follow the transition observed for men unless important lessons are learnt, and applied, about smoking disincentives for women. Second, the factors that move countries from phase two (rising or stable prevalence) to phase three (modest declines) need to be better understood if this phase of the transition is to accelerate. Third, what has been the role of sociocultural context, including civil society, in moving countries into phase four? This transition has been especially prominent for the Anglo-Saxon and Scandinavian countries, along with Singapore, but, importantly, in several Latin American countries as well, including Brazil, Mexico, Colombia and Costa Rica. The reductions in prevalence observed in Brazil have been attributed to important regulatory measures implemented by the country over the past few decades, and, especially after the ratification of the WHO Framework Convention on Tobacco Control(FCTC) in 2005.31 These measures included a national ban on tobacco advertising, a national comprehensive smoke-free policy, large pictorial health warnings on cigarette packages, and continuous raises in taxes and prices of tobacco products. Recent years have shown a plateauing in the decreasing trend, however. In order to continue to make progress and lower smoking rates even further, a plan for monitoring tobacco use, a list of actions for tobacco control and national tobacco use reduction goals were added to the country’s ‘Strategic Action Plan for Coping with Noncommunicable Diseases, 2011–2022’.33 34 Other countries in the region have also implemented tobacco control strategies over the past couple of decades, though the level of compliance and enforcement has varied within and across countries. Important lessons can be learnt on successfully reducing prevalence of smoking by understanding the drivers of change in Brazil, and other countries in the region.
Our findings should be interpreted taking into consideration the study’s limitations, primarily related to data quality and availability. Despite rigorous attempts to ensure our estimates are based on comparable and consistent data, data gaps and inconsistencies lead to substantial uncertainty in the trends and patterns of smoking prevalence and consumption in some countries, reducing the policy utility of the estimates. In this study, we used the direct method to estimate PAFs. Note that PAFs have also been estimated using an indirect approach, with the level of lung cancer mortality being used as a measure of the ‘maturity’ of the epidemic in populations, with relative risks from some reference study being scaled accordingly.7 16 The GBD Study previously used the indirect method26 but switched to the direct method a few years ago. We did not find the total burden due to smoking changed significantly using different methods. Given the significant role of recent, reliable and comprehensive information on the smoking epidemic for guiding and evaluating policy responses in countries, much more could be done to assist countries to improve their epidemiological surveillance capacity and systems, especially for smoking prevalence, consumption and mortality data.
Timely, detailed, reliable and comparable estimates of tobacco use and its harms provide the essential health intelligence for countries and the global tobacco control community alike on which to determine policy imperatives, identifying populations where smoking control measures have been particularly successful, as well as populations where urgent policy action is required to reduce future disease burden. Predictions of 1 billion deaths from smoking this century unless there is urgent and substantial progress with cessation strategies19 highlight the enormous toll of avoidable mortality that smoking will cause, in the absence of effective national policy responses, especially in high prevalence countries. Protection and promotion of public health requires that countries not only respond urgently to controlling global pandemics, such as COVID-19, but equally urgently and simultaneously act more decisively against large, preventable and systemic causes of premature death and health loss, particularly smoking.
What this paper adds
We provide a 50-year evolution of the smoking epidemic worldwide according to broad phases characterised by prevalence trends among men and women, as well as by age, sex, country, region, Sociodemographic Index and birth cohorts; these are the key descriptors needed to inform global, regional and national policy action.
We show how mortality attributable to smoking has evolved between 1990 and 2020, by country and separately for men and women, providing the most recent global assessment of the health consequences of smoking and how it has changed.
Using rigorous data-adjustment methods, we provide comparable measures of prevalence and consumption over time and across countries, facilitating assessments of where policies have worked and where they are most needed.
Data availability statement
Data are available upon reasonable request.
Ethics statements
Patient consent for publication
Ethics approval
This study was a secondary analysis based on publicly available datasets. The included surveys and studies were all approved by the Institutional Review Boards and the respondents provided written informed consent. Ethical approval was not required for the analysis of those anonymised data.
References
Footnotes
Contributors XD had full access to, verified all the data in the study, and takes responsibility for the integrity of the data and the accuracy of the data analysis. ADL controlled the decision to publish and takes full responsibility for the work. Conceptualisation—all authors. Data curation— XD. Supervision—EG and ADL. Methodology—all authors. Statistical analysis and programming—XD. Visualisation—XD. Writing (first draft)—XD and ADL. Writing (review and editing)—all authors.
Funding XD and EG received funding through grant projects from Bloomberg Philanthropies and the Bill & Melinda Gates Foundation.
Disclaimer The funders of the study had no role in study design, data collection, data analysis, data interpretation or writing of the report.
Map disclaimer The inclusion of any map (including the depiction of any boundaries therein), or of any geographic or locational reference, does not imply the expression of any opinion whatsoever on the part of BMJ concerning the legal status of any country, territory, jurisdiction or area or of its authorities. Any such expression remains solely that of the relevant source and is not endorsed by BMJ. Maps are provided without any warranty of any kind, either express or implied.
Competing interests None declared.
Provenance and peer review Commissioned; externally peer reviewed.
Supplemental material This content has been supplied by the author(s). It has not been vetted by BMJ Publishing Group Limited (BMJ) and may not have been peer-reviewed. Any opinions or recommendations discussed are solely those of the author(s) and are not endorsed by BMJ. BMJ disclaims all liability and responsibility arising from any reliance placed on the content. Where the content includes any translated material, BMJ does not warrant the accuracy and reliability of the translations (including but not limited to local regulations, clinical guidelines, terminology, drug names and drug dosages), and is not responsible for any error and/or omissions arising from translation and adaptation or otherwise.